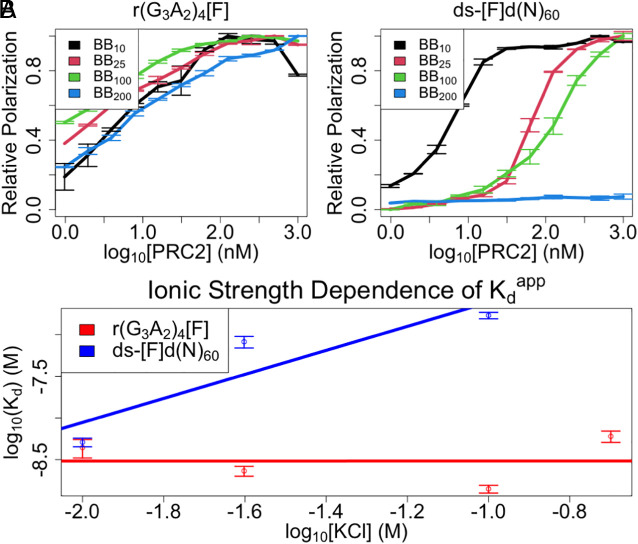
Fig. 3.
Ionic interactions contribute to PRC2’s dsDNA but not G4 RNA affinities. FP-based equilibrium binding experiments (Materials and Methods) were carried out under various salt concentrations (BBX = X mM KCl) for a G4 RNA and 60-bp dsDNA ligand (no competitor present). Kinetic constant values from regression can be found in Table 1, additional nomenclature definitions are in SI Appendix, Table S1, and polynucleotide species definitions are in SI Appendix, Table S2. (A) Binding curves for indicated PRC2 ligands. Curves are composites of three experiments with four replicates each, where error bars indicate mean ± SD. Solid lines are visual aids connecting the data points. (B) Affinity versus ionic strength plots with Kdapp values from regression of data in panel A. Data are composites of all experiments in panel A, where error bars indicate mean ± SD. Solid lines are from linear regression of data on the logarithmic axes shown. Regression values can be found in Materials and Methods or the corresponding text.

