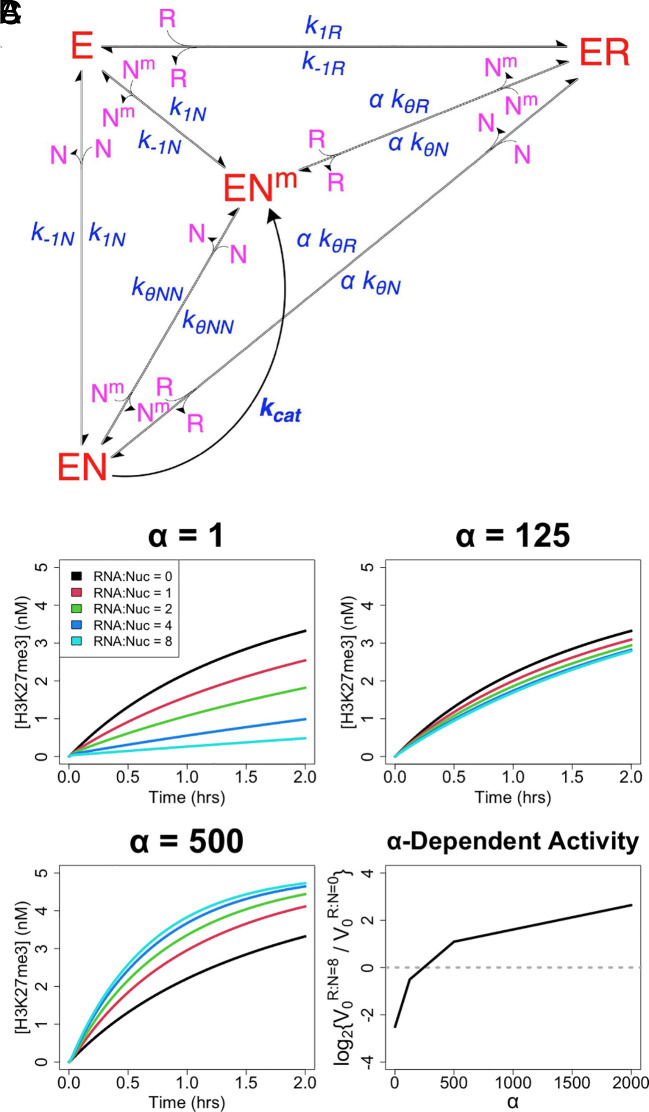
Fig. 4.
Direct transfer allows RNA to boost PRC2 HMTase activity. (A) Reaction scheme of PRC2-like protein (E) binding of RNA (R) and nucleosomes (N) with catalytic activity on nucleosomes (Nm), where conjugates are complexes of the respective reactants. Major protein states are shown in red, additional reactants in purple, and rate constants and tuning parameters in blue. For rate constants, k1 is for association, k−1 is for dissociation, kθ is for direct transfer, and kcat is for catalysis. The α tuning parameter is included for any protein complex transitions where RNA–nucleosome direct transfer is possible. It is an adjustment of effective molarity for direct transfer reactions, meant to account for the spatial proximity of nascent RNA and nucleosome DNA (e.g., nascent RNA), but it has a complex relationship with other factors that warrants qualitative interpretation (see corresponding text). Specific nomenclature definitions are in SI Appendix, Table S1. These reactions are described by the system of differential equations, SI Appendix, Eq. S5 . Inter-complex transitions defined by the kθ rate constants are like those shown in Fig. 1, and their removal collapses this scheme to a classic model. (B) Reactions were simulated using SI Appendix, Eq. S5 for the scheme (panel A) to monitor rate of nucleosome methylation (H3K27me3) over time under varying RNA–nucleosome molar ratios (RNA:Nuc), direct transfer effective molarity adjustments (α), and protein concentrations. Black curves represent HMTase time-course reactions in the absence of RNA, and the colored lines represent the effect of increasing RNA concentrations. For simulations, k−1, kθ, and Kd values were taken from Table 1, kcat was taken from prior PRC2 literature, [NT] = 5 nM, [ET] = 0.1–2 × KdN, and other parameter values are indicated; explicit values are provided in Materials and Methods. Limited data from a single protein concentration (2 × KdN) are shown, but the full data set is provided in SI Appendix, Fig. S4. (C) HMTase activity rate data were used to calculate the relative initial rates (V0) for reactions with 8:1 versus 0:1 RNA–nucleosome molar ratios (R:N), across a range of α values. Data used were the same as for panel B. Dotted line is a visual aid for when RNA concentration has no effect on initial reaction rate.

