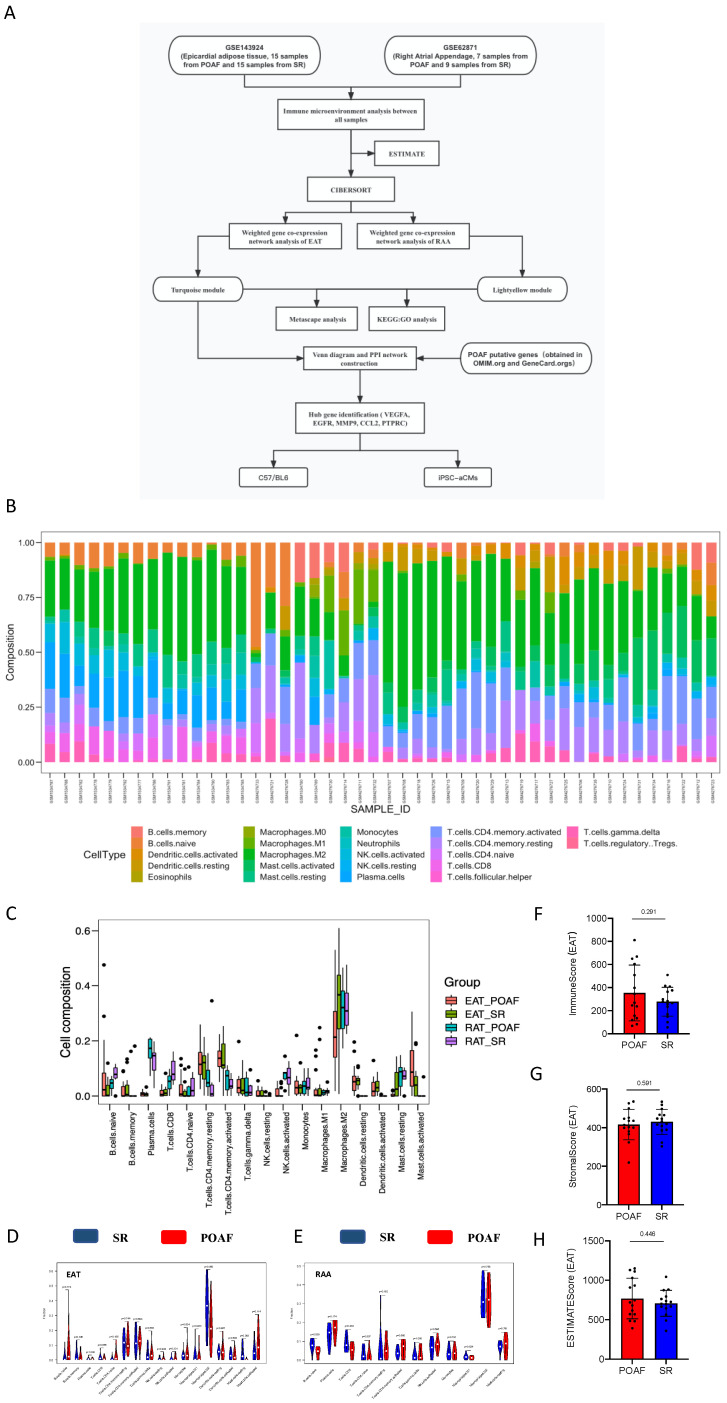
Figure 1.
Comparison of immune cluster characterization and cell abundance between EAT and the RAA. A. Flowchart of bioinformatics analysis. B. Relative expression of 22 immune cell abundance stacked column charts in EAT and RAA samples estimated using CIBERSORT. C-E. Immune cluster characterization and cell abundance histogram of all included samples, with EAT samples and RAA samples using CIBERSORT. F-H. Immune, stromal, and estimate scores of EAT samples using ESTIMATE.

