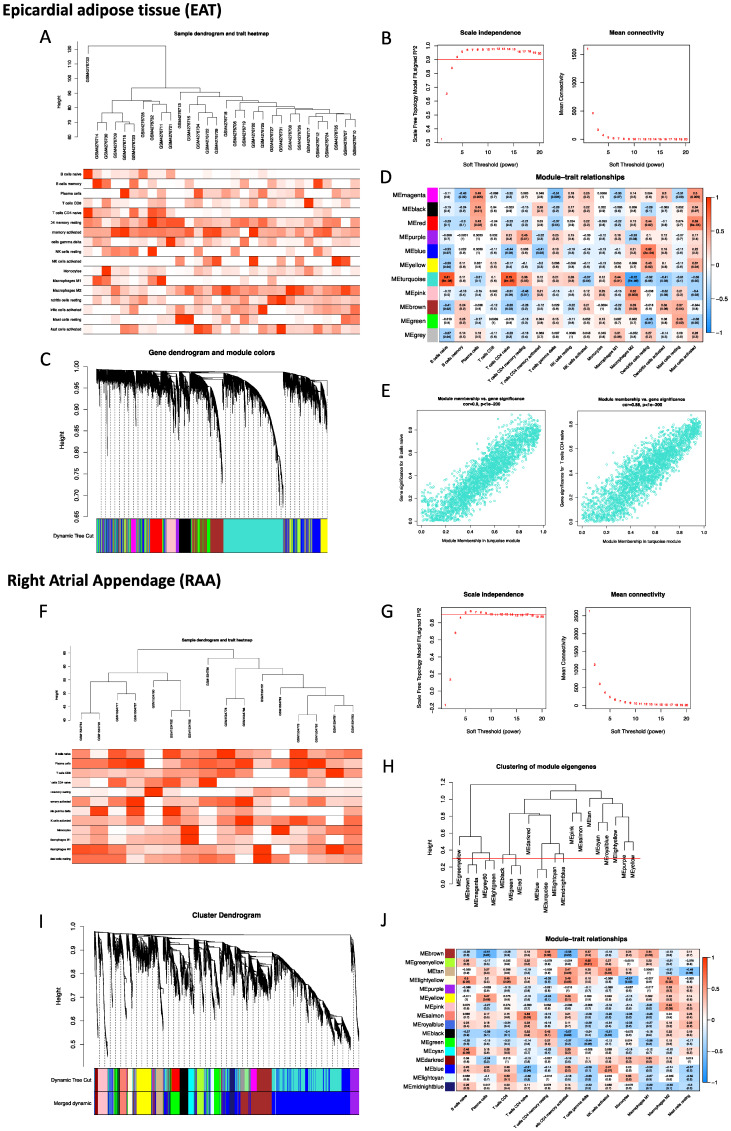
Figure 2.
Construction of the weighted co-expression network and identification of key modules. A. Sample dendrogram and trait heatmap of EAT. B. Selection of the soft-thresholding power β in EAT analysis. C. Dendrogram of all selected genes in EAT. D. Heatmap of module-trait relationships for EAT in the constructed network. E. Scatter diagrams for module membership vs. gene significance of the disease state in the turquoise module. F. Sample dendrogram and trait heatmap of the RAA. G. Selection of the soft-thresholding power β in RAA analysis. H. Clustering diagram of module eigengenes. I. Dendrogram of all selected genes in the RAA. J. Heatmap of module-trait relationships of the RAA in the constructed network.

