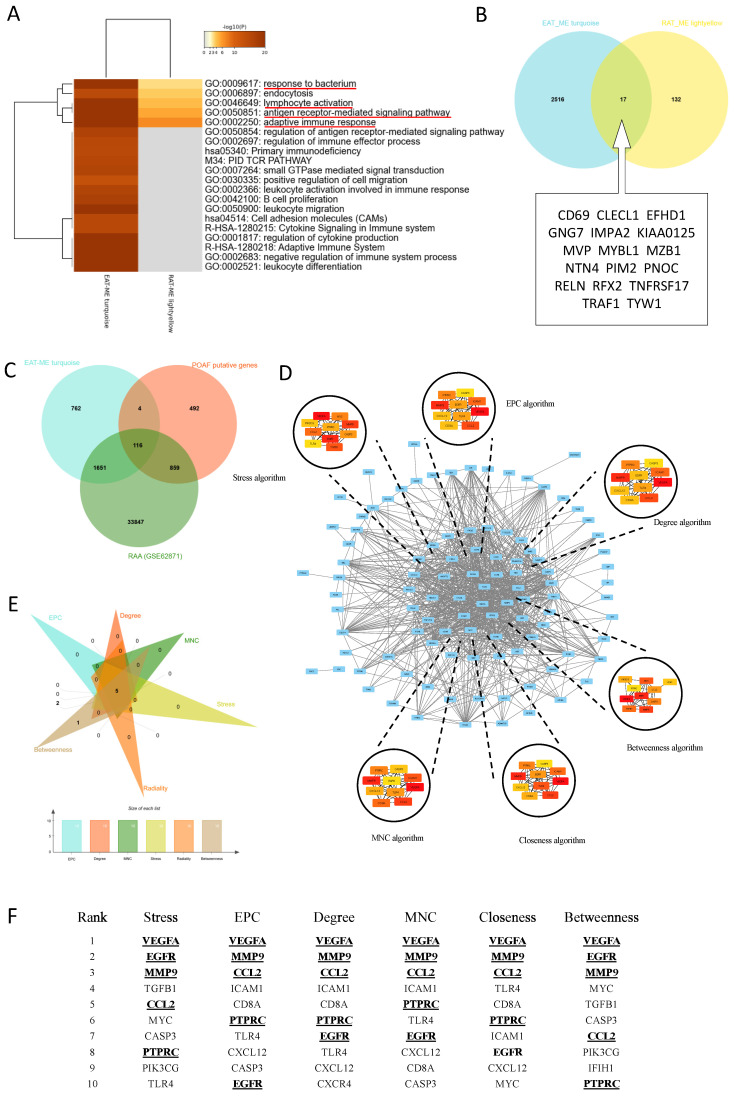
Figure 3.
Identification biological functional and hub genes simultaneously targeted in EAT and the RAA. A. Pathway enrichment analysis of turquoise and light-yellow modules. Biological functions that were enriched in the top 20 genes with the smallest p value. B. Venn diagram of the two modules. The 17 genes listed in the box were identified as common genes. C. Venn diagram of the POAF putative genes, all genes detected in GSE62871, and all genes obtained in the turquoise module. D. Visualization of the protein-protein interaction (PPI) network of the obtained genes from Figure 3C, and top 10 hub genes identified by six algorithms including Stress, EPC, Degree, MNC, Closeness and Betweenness. E-F. Venn diagram and table of genes obtained from the above six algorithms. The identified hub genes are indicated with underlining.

