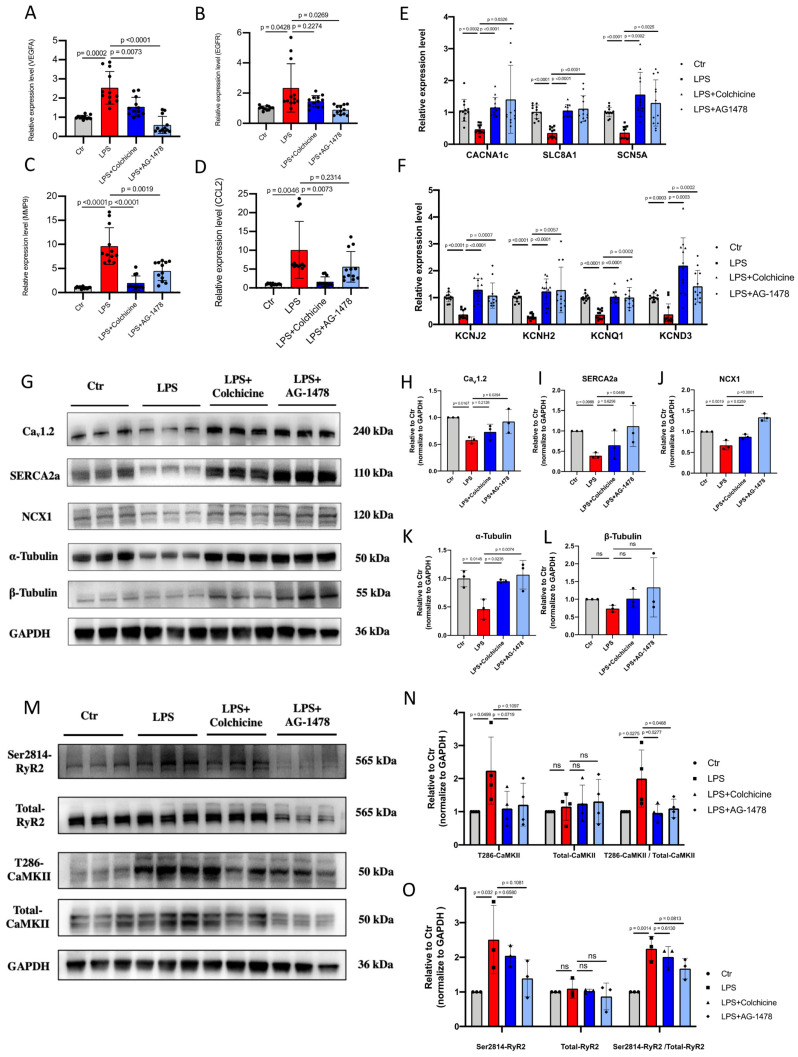
Figure 7.
Colchicine or AG-1478 restores the altered expression of ion channels, Ca2+-handling proteins and α-tubulin in atrial tissues of LPS-stimulated mice. A-D. Bar graphs to compare the mRNA expression levels of hub genes (VEGFA, EGFR, MMP9, CCL2) between atrial tissues of the control group, LPS group, LPS + colchicine group, and LPS + AG-1478 group. n= 12 mice. E-F. Bar graphs to compare the mRNA expression levels of multiple ion channel genes (CACNA1C, SLC8A1, SCN5A, KCNJ2, KCNH2, KCNQ1 and KCND3) between the atrial tissues of the control group, LPS group, LPS + colchicine group, and LPS + AG-1478 group. n= 12 mice. G. Western blot analysis of the protein expression of Cav1.2, NCX1, SERCA2a, α-Tubulin and β-Tubulin in atrial tissues of the control group, LPS group, LPS + colchicine group, and LPS + AG-1478 group. H-L. Bar graphs to compare the protein expression of Cav1.2, NCX1, SERCA2a, α-Tubulin and β-Tubulin in different groups in Figure 7G. n= 3 independent experiments. M. Western blot analysis of the protein expression of Ser2814-RyR2, total RyR2, T286-CaMKII and total CaMKII in atrial tissues of the control group, LPS group, LPS + colchicine group, and LPS + AG-1478 group. N-O. Bar graphs to compare the protein expression of Ser2814-RyR2, total RyR2, T286-CaMKII and total CaMKII in different groups in Figure 7M. n= 3-4 independent experiments.

