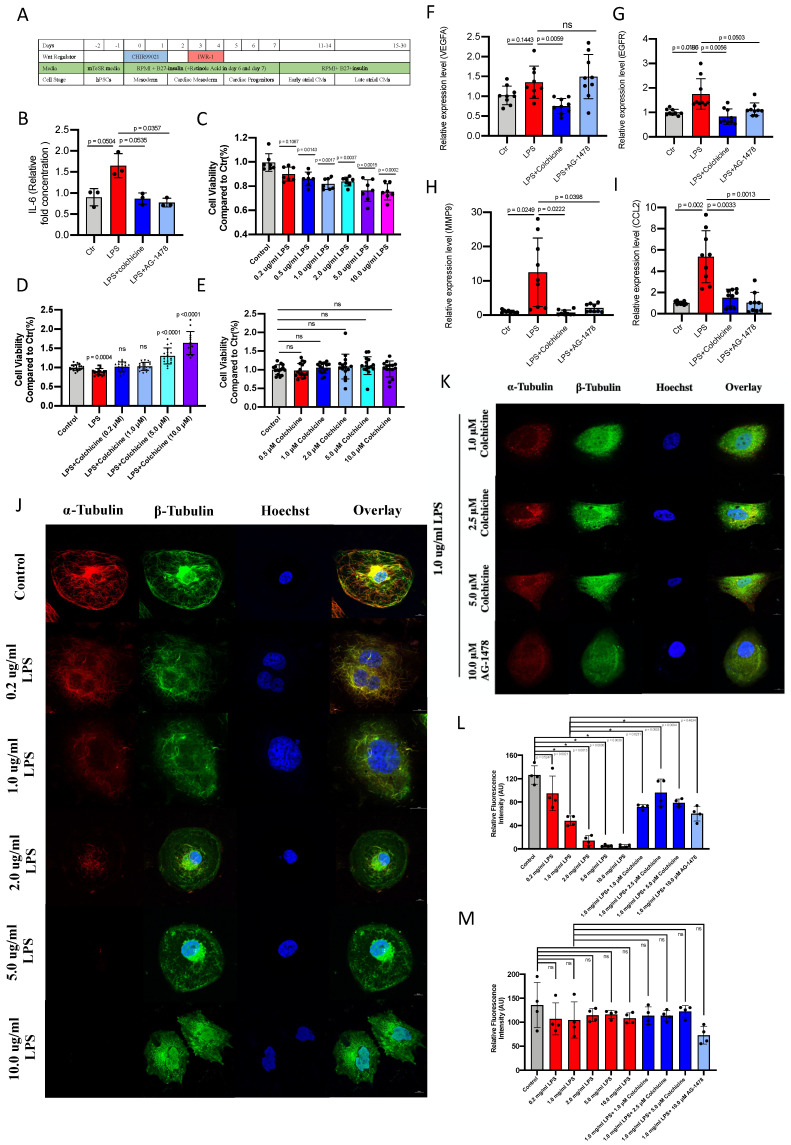
Figure 8.
Colchicine or AG-1478 protects against cell death and stabilizes microtubules from acute inflammation in iPSC-aCMs. A. Protocol for generation of iPSC-aCMs. B. Bar graph to compare IL-6 levels as determined by ELISA assays between baseline iPSC-aCMs (control), iPSC-aCMs treated with LPS alone (LPS group), iPSC-aCMs treated with LPS and colchicine (LPS + colchicine group), and iPSC-aCMs treated with LPS and AG-1478 (LPS + AG-1478 group), respectively. n= 3 biological replicates. C. Bar graph to compare cell viability as detected by CCK-8 assays between iPSC-aCMs treated with LPS at different concentrations for 24 hours. n= 7 biological replicates. D. Bar graph to compare cell viability between iPSC-aCMs treated with 1.0 μg/ml LPS and colchicine at different concentrations for 24 hours. n= 13-21 biological replicates. E. Bar graph to compare cell viability between iPSC-aCMs treated with colchicine at different concentrations for 24 hours. n= 15 biological replicates. F-I. Bar graphs to compare mRNA expression levels of hub genes (VEGFA, EGFR, MMP9, CCL2) between the control group, LPS group, LPS + colchicine group, and LPS + AG-1478 group. n= 9 biological replicates. J-K. Representative immunofluorescence staining of α-Tubulin (red) and β-Tubulin (green) in baseline iPSC-aCMs, iPSC-aCMs treated with LPS at different concentrations for 24 hours; iPSC-aCMs treated with 1.0 μg/ml LPS and colchicine at different concentrations for 24 hours; and iPSC-aCMs treated with 1.0 μg/ml LPS and 10 μM AG-1478. Scale bar, 10 μm. L-M. Bar graphs to compare the fluorescence intensity of α-Tubulin and β-Tubulin between different groups in J-K. The stained microtubules from 4 images were selected and quantified by ImageJ.

