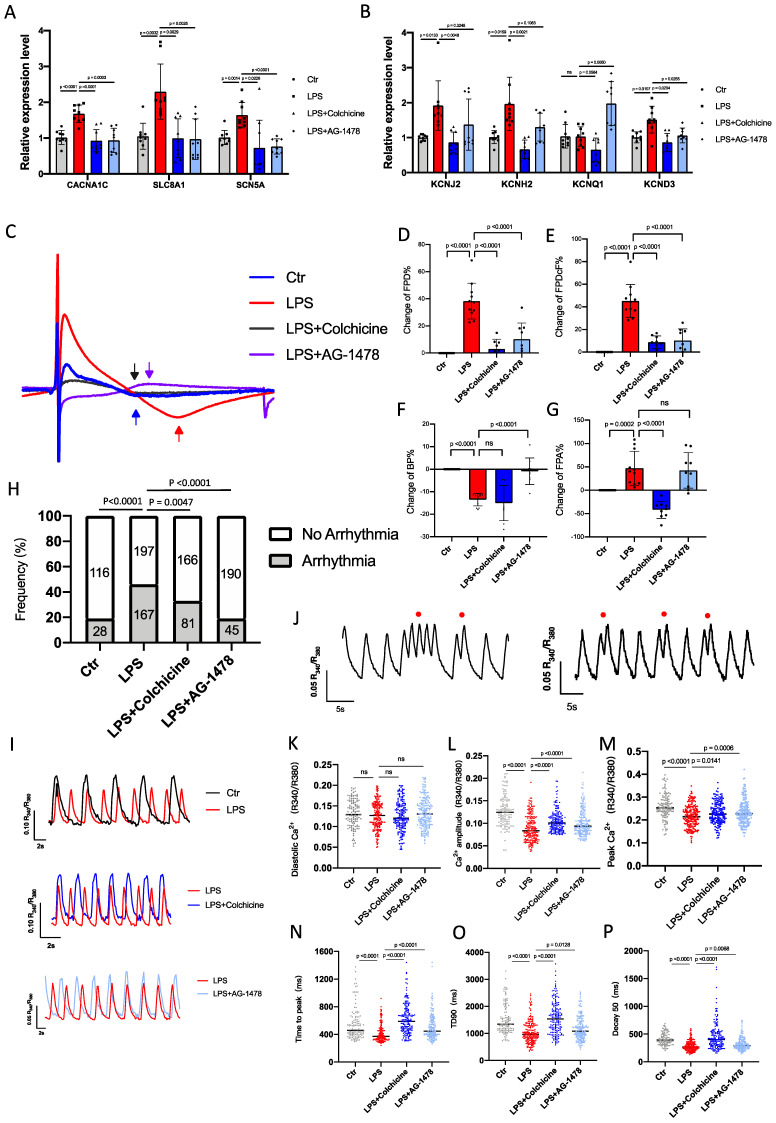
Figure 9.
Colchicine or AG-1478 normalizes the prolonged field potential duration in LPS-stimulated iPSC-aCMs. A-B. Bar graphs to compare the mRNA expression levels of multiple ion channel genes (CACNA1C, SLC8A1, SCN5A, KCNJ2, KCNH2, KCNQ1 and KCND3) between iPSC-aCMs of the control group, LPS group, LPS + colchicine group, and LPS + AG-1478 group. n= 9 biological replicates. C. Representative field potential tracings recorded from iPSC-aCMs of the control group, LPS group, LPS + colchicine group, and LPS + AG-1478 group. The iPSC-aCMs were derived from two healthy control iPSC lines. D-G. Bar graphs to compare the change of FPD%, change of FPDcF%, change of BP% and change of FPA% between different groups in Figure 9C. n= 9-11 biological replicates. H. Bar graph to compare the percentage of arrhythmia‐like irregular Ca2+ transients between iPSC-aCMs of the control group, LPS group, LPS + colchicine group, and LPS + AG-1478 group. n= 116-198 cells. I. Representative Ca2+ transient tracings recorded from iPSC-aCMs of the control group, LPS group, LPS + colchicine group, and LPS + AG-1478 group. J. Representative Ca2+ transient tracings recorded from iPSC-aCMs of LPS group. Red circles denote arrhythmia‐like irregular Ca2+ transients. K-P. Scatter dot plots to compare diastolic [Ca2+]i, Ca2+ amplitude, peak Ca2+, time to peak, transient duration 90 (TD90) and decay50 between the different groups of Figure 9I.

