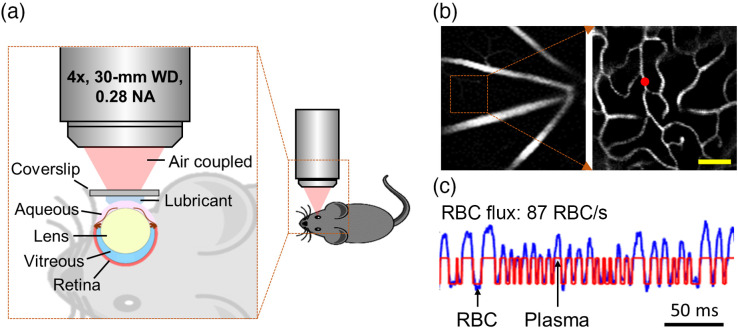
Fig. 1.
Measurements of capillary RBC flux in the retina. (a) Schematics of animal positioning. (b) Angiogram images acquired in the retina. The zoomed-in image on the right side was acquired approximately inside the region of interest enclosed by the square in the left image, but at a greater depth. Scale bar: . (c) A representative fluorescence intensity time course (0.25-s-long trace) acquired in the capillary at the location denoted by the red dot in (b). The blue and red curves represent the experimental and fitted time courses, respectively. The “valley” and “peak” denoted by the arrows represent the RBC- and plasma-passages through the optical focal volume, respectively.

