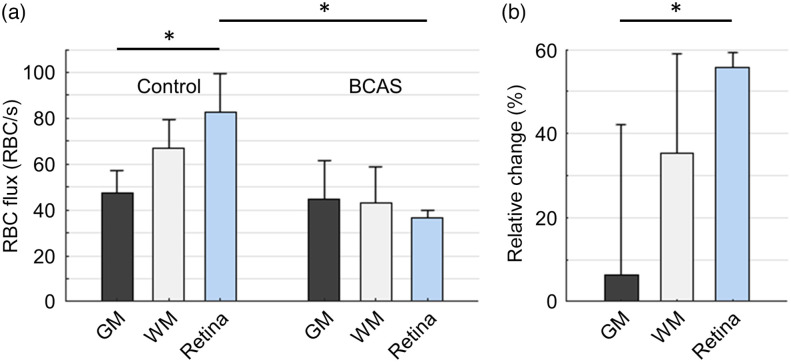
Fig. 3.
Comparisons of the BCAS-induced changes of capillary RBC flux in the cerebral GM, WM, and retina. (a) Mean capillary RBC flux in the cerebral cortical GM, subcortical WM, and retina. The measurements in the GM were performed in 343 and 262 capillaries, across control mice and mice subjected to BCAS, respectively; the measurements in the WM were performed in 191 and 133 capillaries, across control mice and mice subjected to BCAS, respectively.27 The measurements in the retina are the same as in Fig. 2. The mean value in each group was first calculated over the capillaries of each mouse and then across mice. The comparisons were carried out using two-way ANOVA followed by the Tukey HSD post hoc test. The asterisk symbol (*) indicates statistical significance (). (b) The BCAS-induced relative changes of capillary RBC flux in the GM, WM, and retina. In each group (e.g., GM, WM, or retina), the relative RBC flux change corresponding to each BCAS animal was calculated as the ratio of the difference between the mean control RBC flux value averaged over all the control animals in that group and the RBC flux value of that specific BCAS animal to the mean control RBC flux value averaged over all the control animals in that group. The comparisons were carried out using one-way ANOVA followed by the Tukey HSD post hoc test. The asterisk symbol (*) indicates statistical significance (). Here, we applied a linear mixed-effects model to evaluate the effects of the measurement locations (GM vs. WM vs. retina) and conditions (control vs. BCAS) on the comparisons between the different groups with capillary number per animal as a random variable. We found that the measurement locations (GM, WM, and retina) and conditions (control and BCAS) had significant impacts on the comparisons. Data are expressed as mean ± STD.

