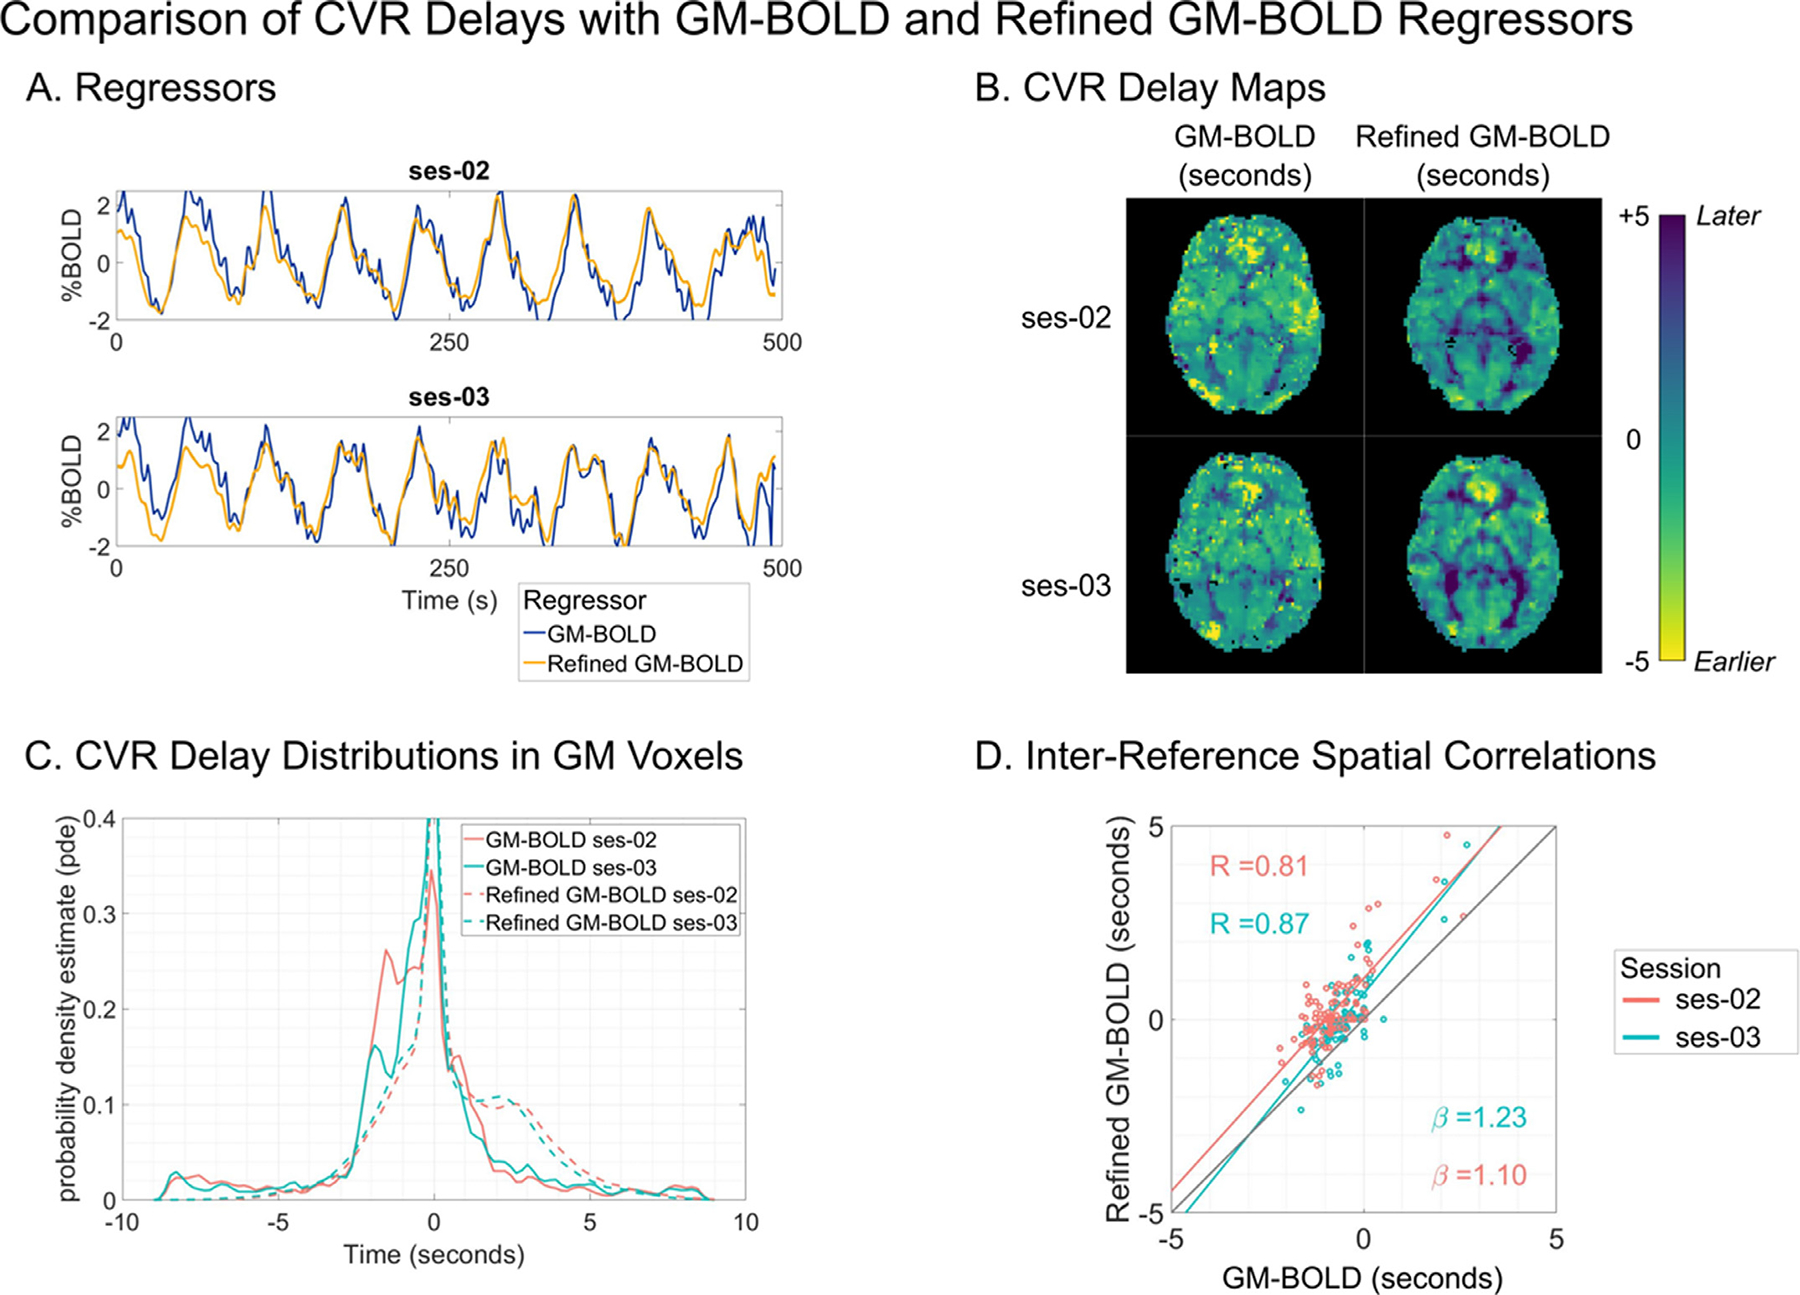
Fig. 10.

A) Reference signal for sub-008 from GM-BOLD (blue) and Refined GM-BOLD (yellow) in ses-02 (top) and ses-03 (bottom). B) CVR delay maps for sub-008, transformed to MNI space. An axial slice from two compared methods is shown in each column: GM-BOLD (left) and Refined GM-BOLD (right). CVR delay maps using the GM-BOLD approach have been normalized to the GM median delay with voxels at boundary conditions removed (absolute delay =±8.7 s, 9 s). Refined GM-BOLD delay maps are re-centered to 0 s and exclude voxels where the similarity function failed (Frederick et al., 2022a). C) CVR delay distributions for sub-008 across GM-BOLD (solid line) and Refined-GM (dashed line) from ses-02 (orange) and ses-03 (teal). D) Inter-reference spatial correlation between GM-BOLD and Refined GM-BOLD delay maps for sub-008 in ses-02 (orange) and ses-03 (teal) with respective best-fit-lines and an identity line (black) for comparison. Each point represents the median delay value in one of the 96 cortical parcels from the Harvard-Oxford cortical atlas. Correlation coefficient (R) for each session is listed on the top left, and the slopes for the lines-of-best-fit (β) for each session are listed on the bottom right.
