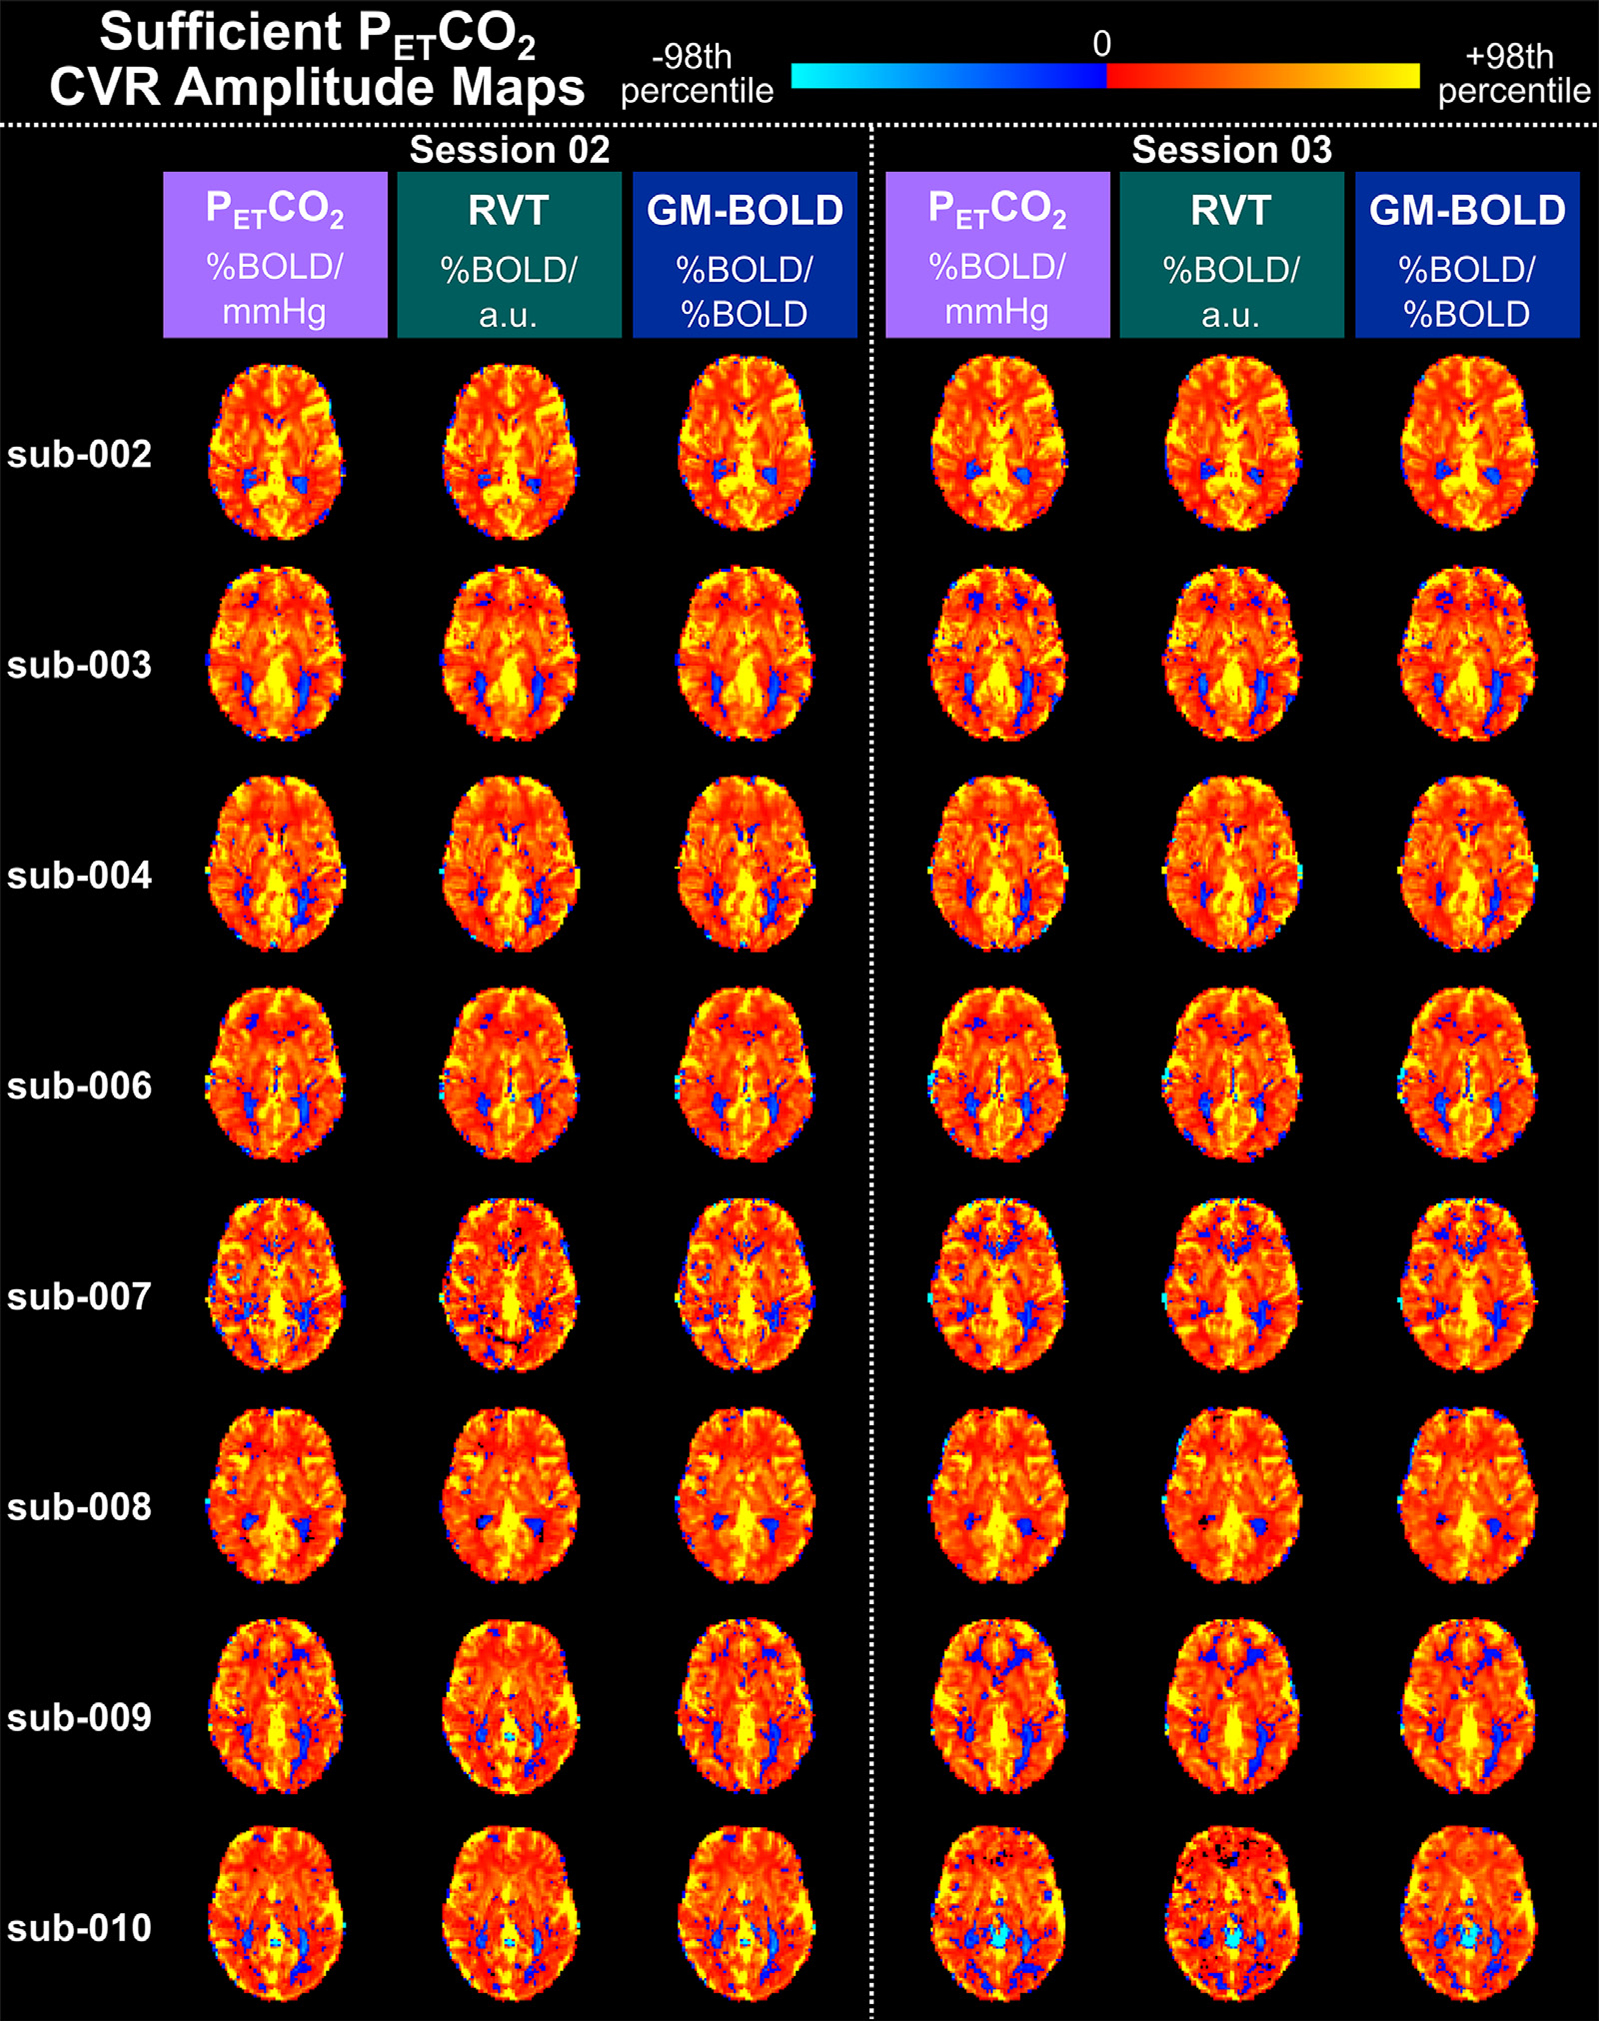
Fig. 3.

Delay-optimized CVR amplitude maps for all 16 datasets with sufficient PETCO2 quality transformed to the MNI152 6th generation template space. For each subject, maps from session 02 are shown on the left and maps from session 03 are shown on the right. A single axial slice of the CVR map from each reference signal is shown in each column. Each CVR map is plotted on a separate color scale. The 98th percentile CVR amplitude value across all voxels was computed for each map (see Table S2 for the magnitudes) and used as the positive and negative limits of the color scale. Voxels with delays at the boundary conditions have been removed. Note the different units of CVR amplitude for each reference signal.
