
Fig. 4.
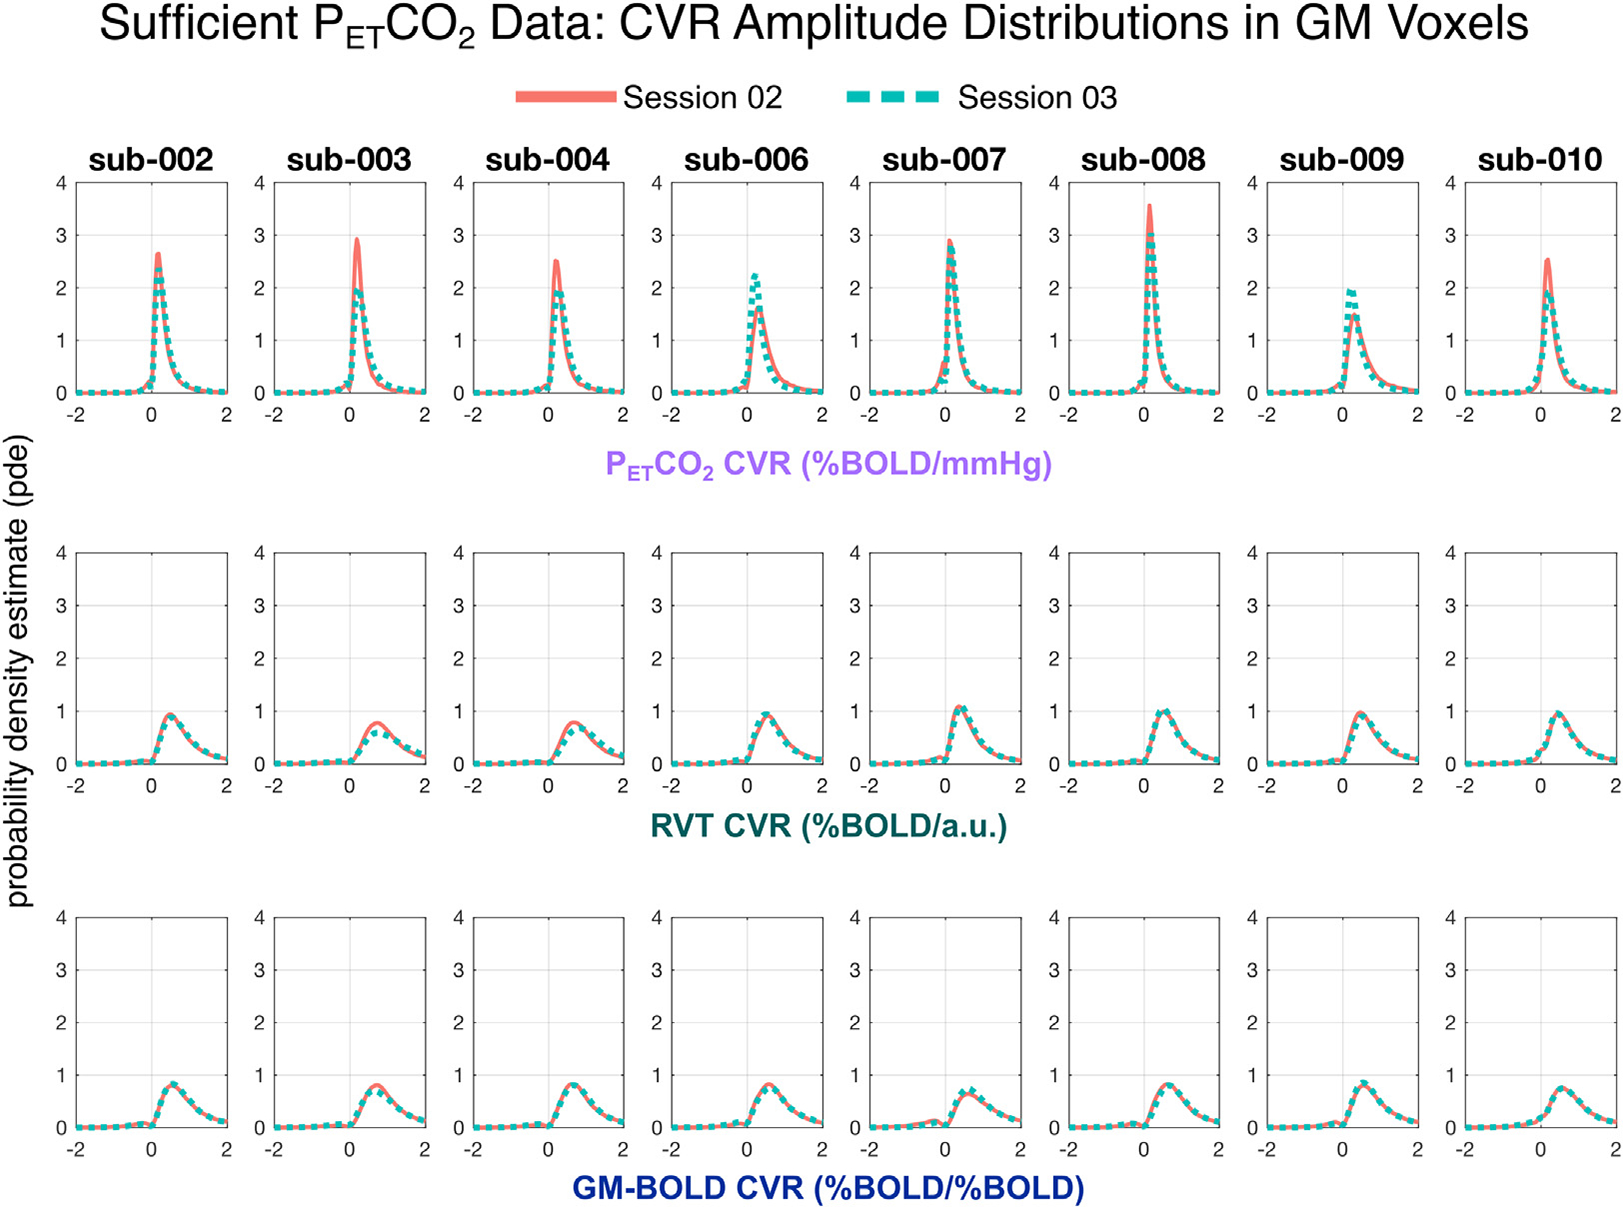
Distributions of CVR amplitude across gray matter (GM) voxels in all sufficient PETCO2 datasets. For each subject, distributions from session 02 are plotted in orange and session 03 are plotted in teal. Each row shows the distribution of CVR amplitude for a different reference signal, with PETCO2 CVR on top, RVT CVR in the middle, and GM-BOLD CVR on the bottom. Note that skewness of the PETCO2 CVR distributions is different from those of the RVT CVR and GM-BOLD CVR because of the range of the plots (from −2 to +2) which matches closer to the 98th percentiles of the latter.