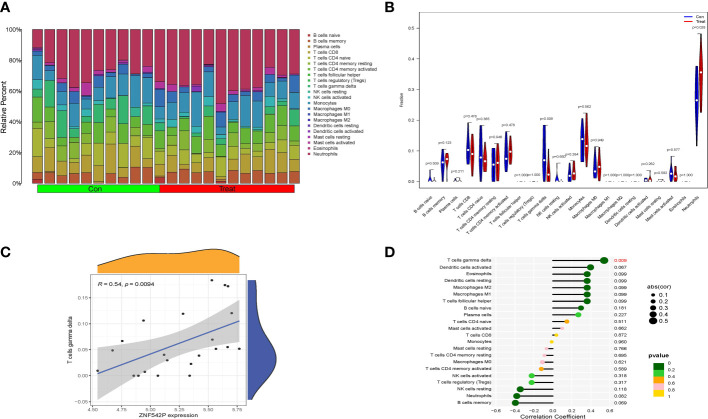
Figure 8.
Correlation between key characteristic gene and immune cell infiltration. (A) Relative percentage of 22 immune cells in each samples. (B) Violin plot of the difference in each type of immune cell between IVDD and control samples. (C, D) The correlation analysis between key characteristic gene and various infiltrating immune cells.

