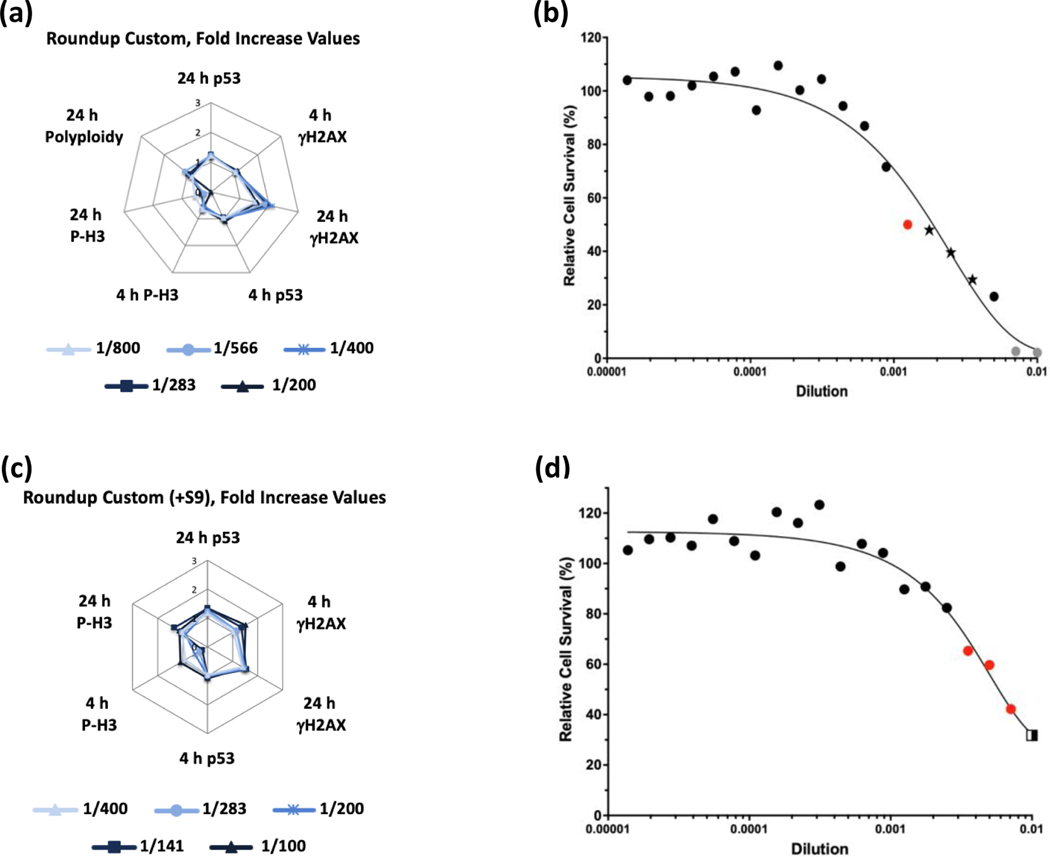
FIGURE 7.
MultiFlow DNA Damage assay results for Roundup Custom in the absence (a, b) or presence of S9 (c, d) are shown in radar charts, accompanied by relative cell survival curves. Each radar chart shows the fold increase over the vehicle control for each biomarker and time point for the five highest consecutive concentrations before meeting cytotoxicity exclusion criteria. Concentrations flagged for genotoxic activity: red circle = neural network algorithm, stars = random forest, neural network, and logistic regression algorithms; gray circles = concentrations that were excluded from analysis due to cytotoxicity (b). Concentrations flagged for genotoxic activity: red circles = neural network algorithm, two-tone square = random forest and neural network algorithms (d).

