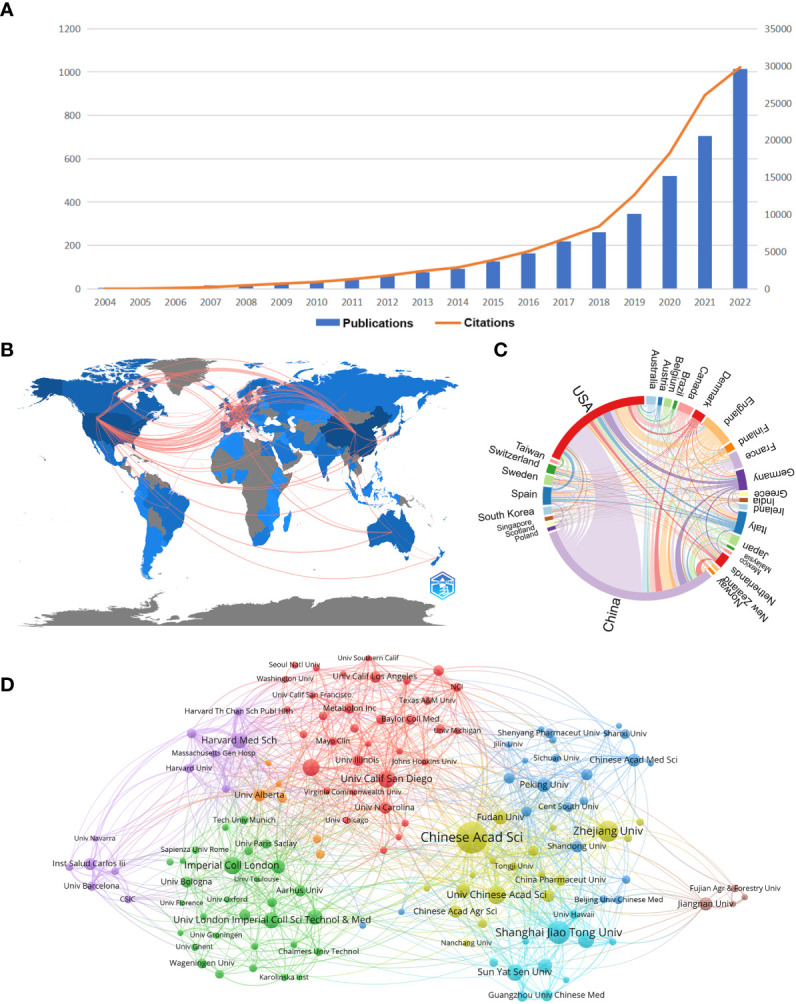
Figure 1.

(A) Trends in the literature related to metabolomics of gastrointestinal flora over the past nineteen years. (B) Country collaboration map in the field of metabolomics of gastrointestinal microbiome. Lines represent the collaboration of the countries. (C) Country/region co-occurrence map of metabolomics studies on the microbiome of gastrointestinal bacteria. The size of the percentage of circles is proportional to the number of articles published in that country/region, and the thickness of the connection reflects the strength of the partnership. (D) Gastrointestinal microbiome metabonomics relevant institutions cluster analysis. Each node represents an institution, and the size of the circle is proportional to the number of articles published by that institution. The higher the centrality of a node, the more times it appears in the shortest path of the whole network, and the greater its influence and significance. Node connections show correlation strength, and more connections indicate more cooperation. (From: VOSviewer, CiteSpace doi: 10.3389/fcimb.2023.1196967).
