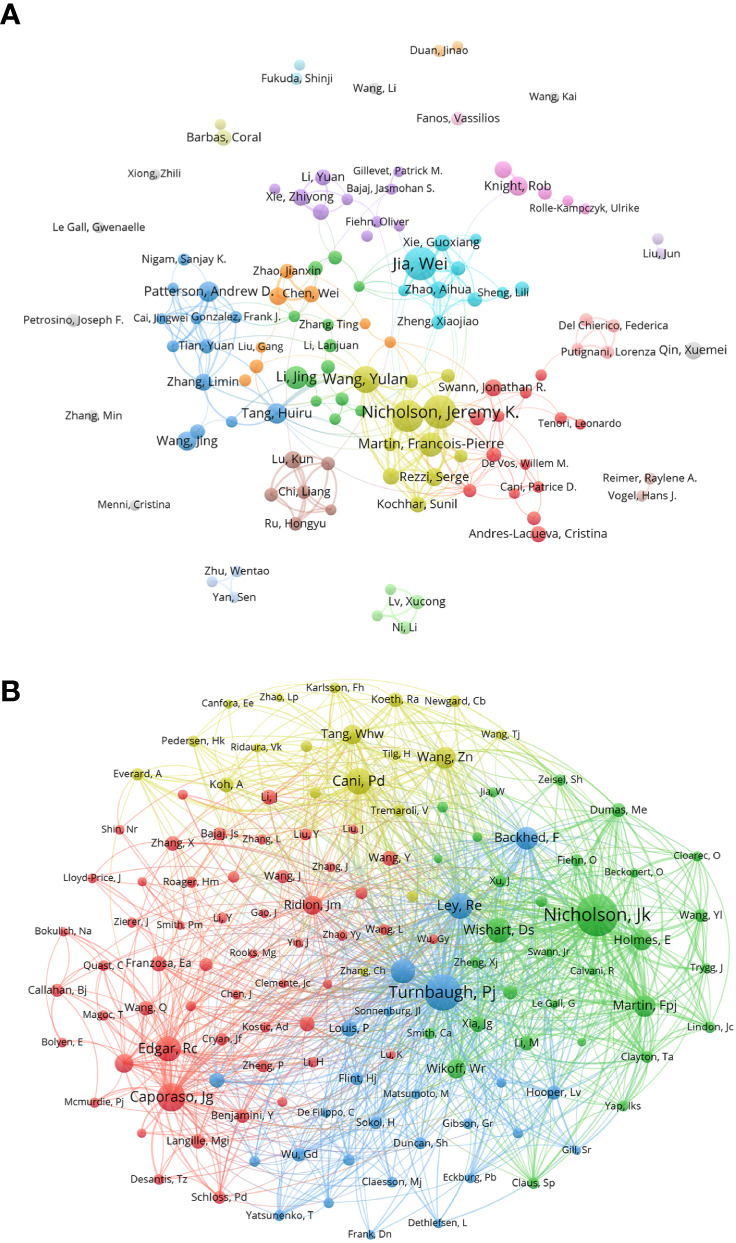
Figure 2.

(A) Co-author in the field of metabolomics of gastrointestinal microbiome, the author of each circle represent different, connect the circle line reflects the connection between the author, different colors of the network represents the author groups often cooperation. (B) Co-cited-author map in the field of metabolomics of gastrointestinal microbiome. The same color indicates that nodes are in the same cluster. Different colored nodes represent the authors of different collaborative relationships. Word size, circle size and connection thickness are positively correlated with co-citation frequency. (From: VOSviewer, CiteSpace doi: 10.3389/fcimb.2023.1196967).
