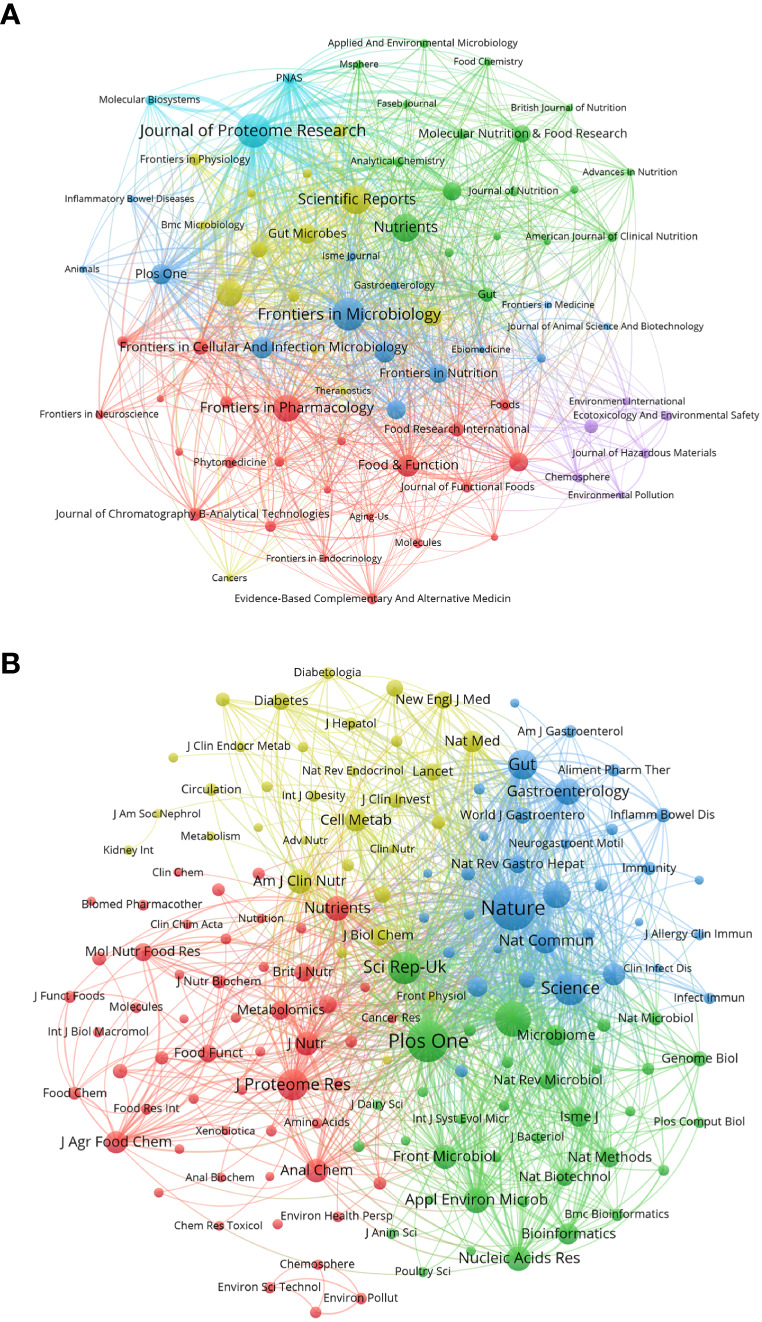
Figure 3.

(A) Gastrointestinal microbiota and metabonomics related journals. Each dot represents a journal. The same color indicates that the nodes are in the same cluster. Node size and link thickness reflect the frequency of journal cooperation. (B) Co-cited-journal analysis related to gastrointestinal microbiology and metabolomics. The same color indicates that the nodes are in the same cluster. The size of nodes reflects the co-citation frequency of journals, and the link represents the co-citation relationship between journals, which is proportional to the thickness of the link. (From: VOSviewer, CiteSpace doi: 10.3389/fcimb.2023.1196967).
