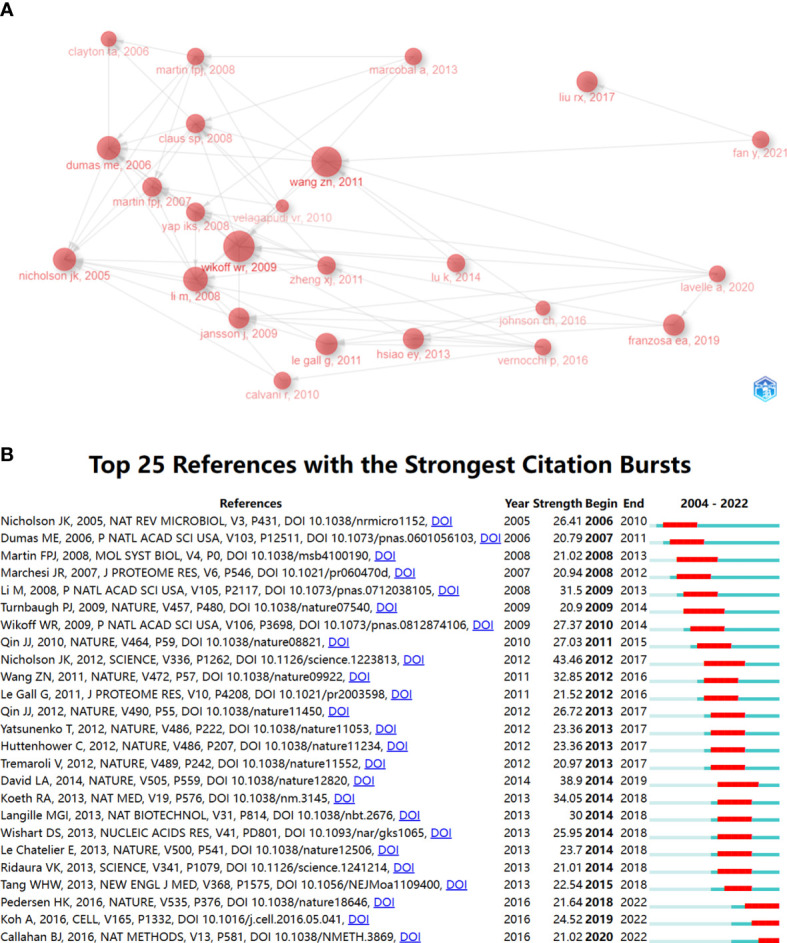
Figure 5.

(A) Relationship graph of high cited articles, the connecting lines represent the citations between them. sizes of nodes mean citations of documents. (B) The top 25 references involving the strongest citation burst in gastrointestinal microbiota metabolomics, sorted by year of origin, the blue bars mean the reference had been published, the red bars represent citation burstness.
