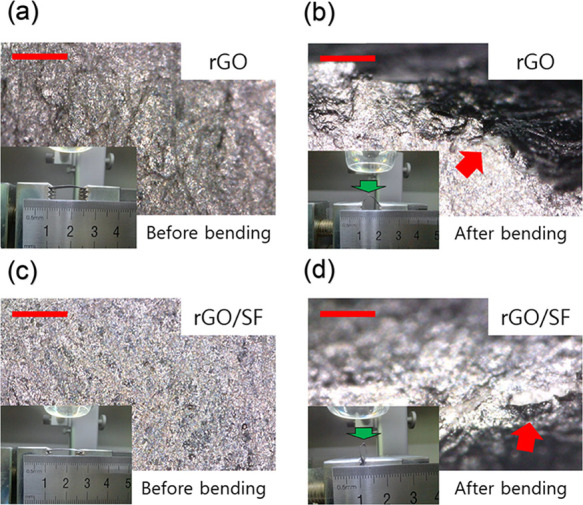
Figure 10.

Surface of the rGO sensor (a) before and (b) after the bending test (diameter: 2.1 mm), and the surface of the rGO/SF sensor (c) before and (d) after the bending test (diameter: 0.8 mm). The delamination area is shown by a red arrow. All scale bars are 200 μm.
