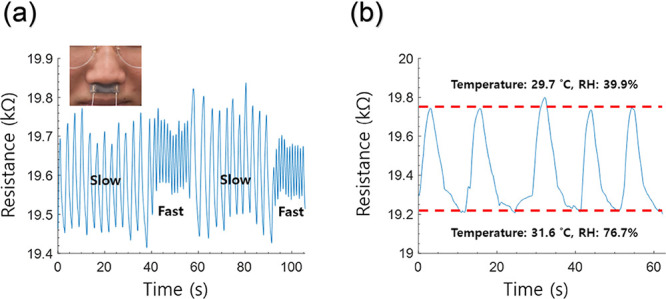
Figure 12.

(a) Respiration rates detected by the rGO/SF sensor. (b) Electrical signal of the rGO/SF sensor in the philtrum region induced by the inhaled air (upper red dashed line; temperature of 29.7 °C and relative humidity of 39.9%) and exhaled air (lower red dashed line; temperature of 31.6 °C and relative humidity of 76.7%).
