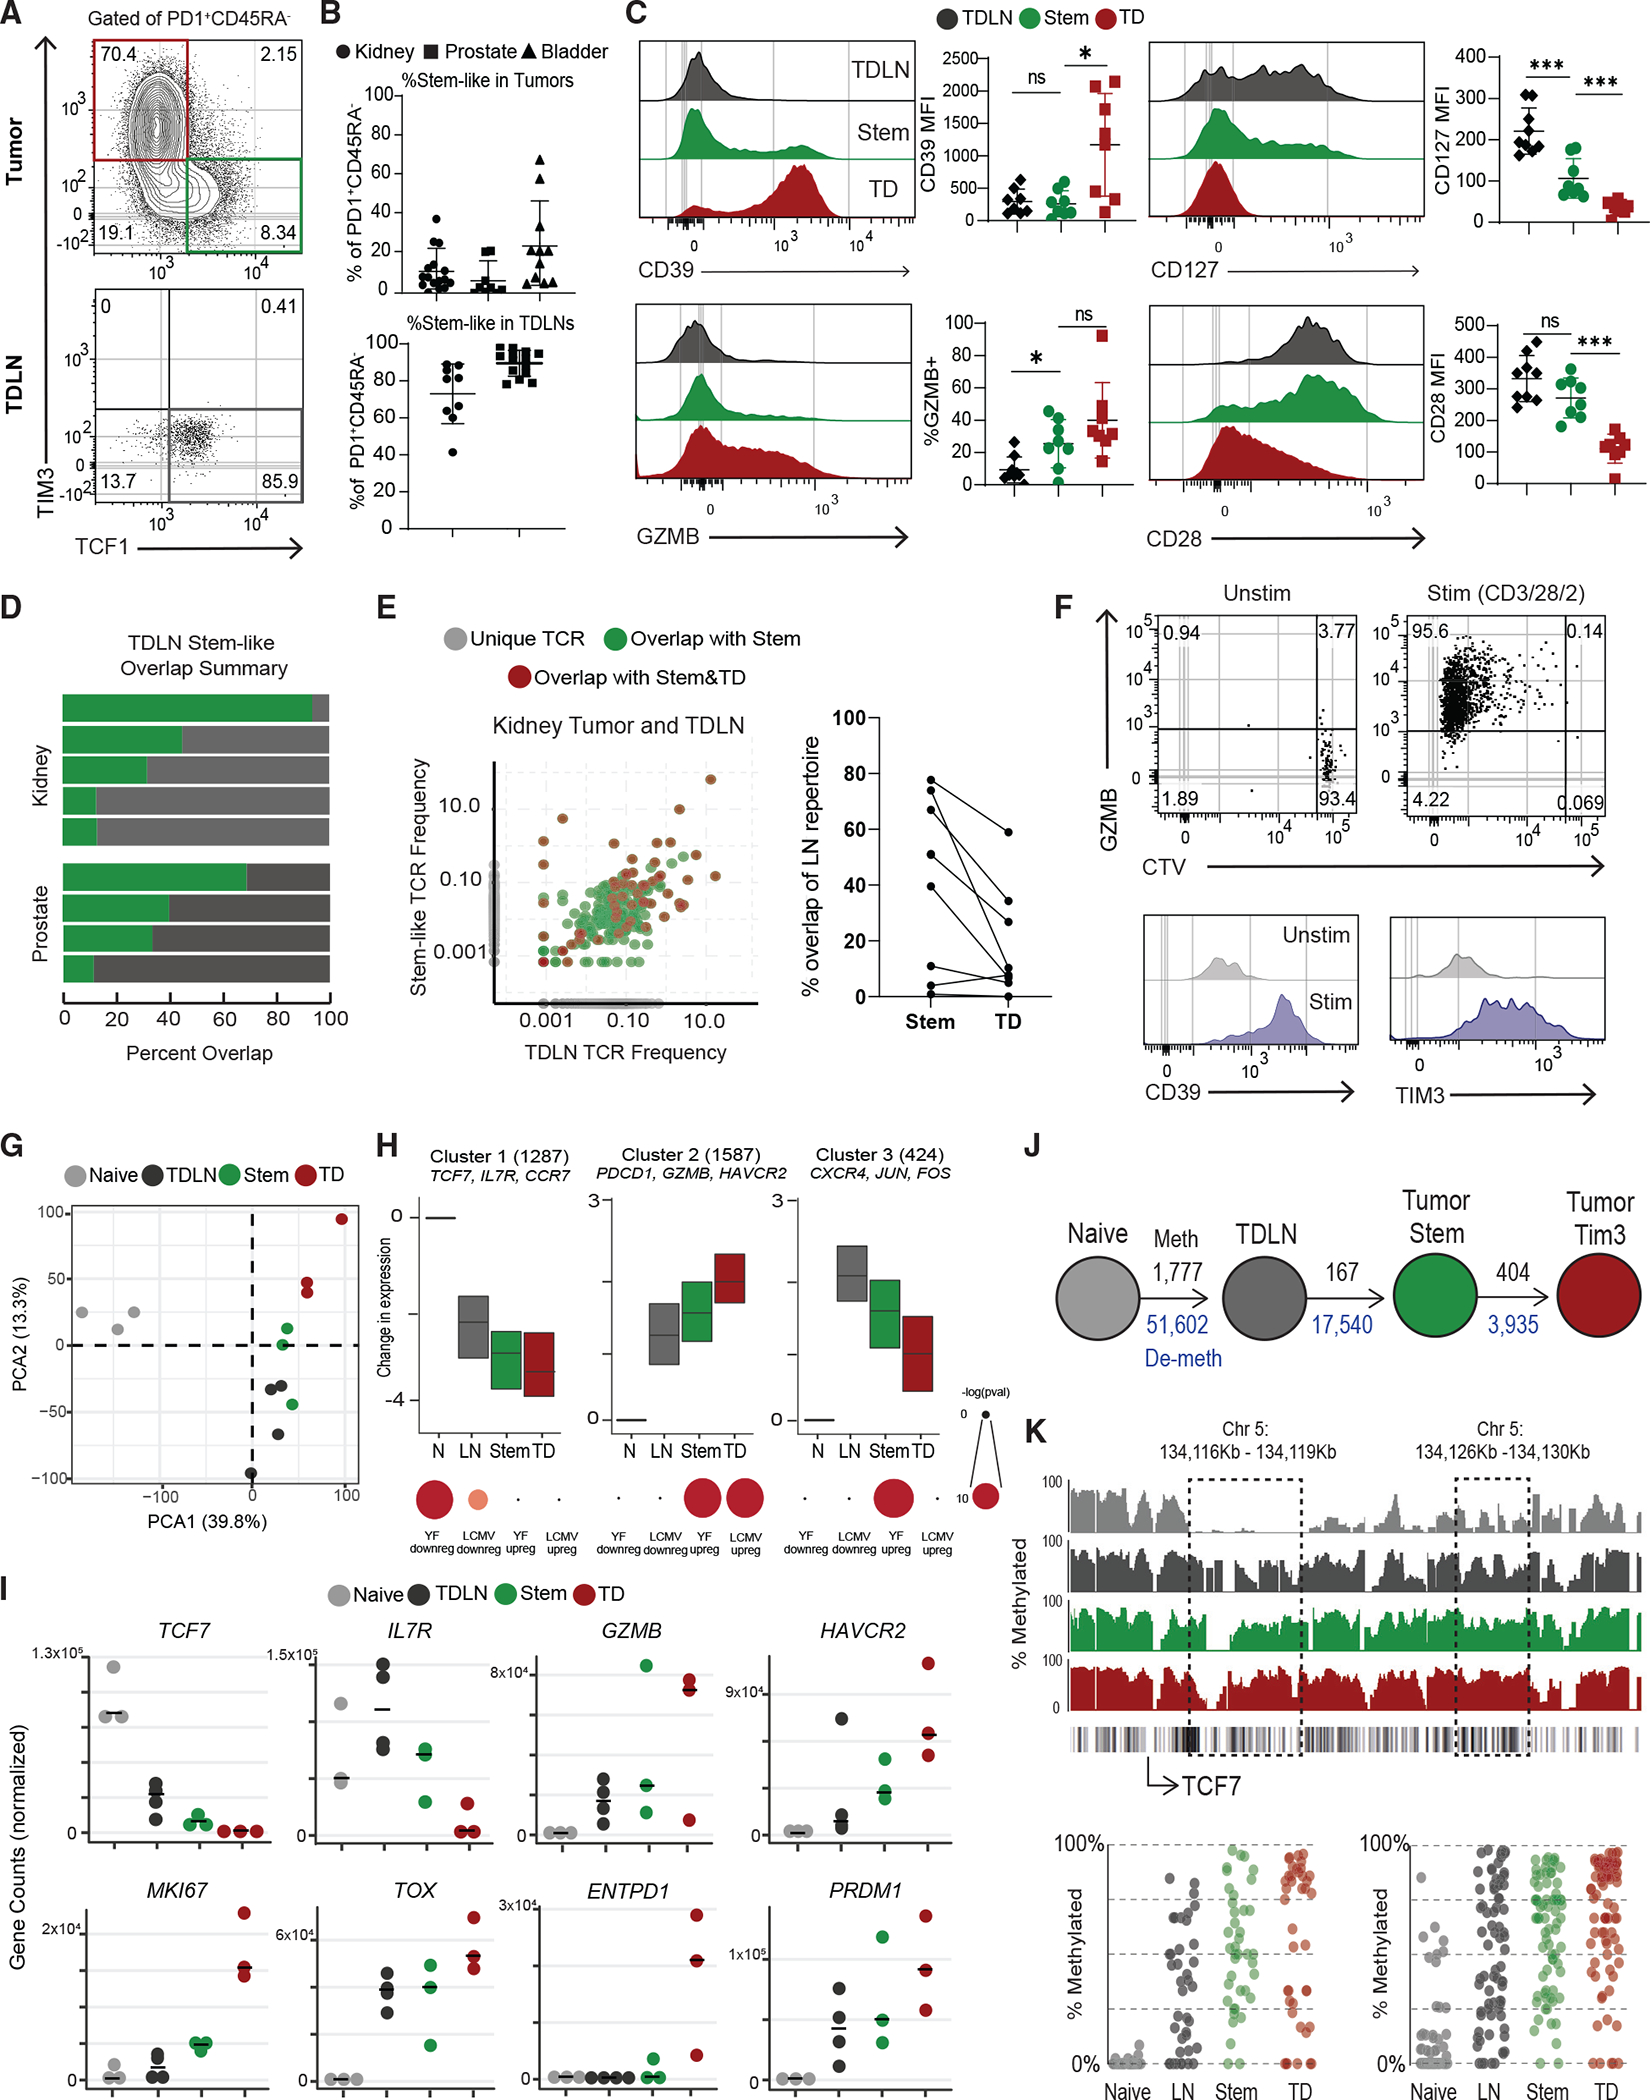
Figure 1. Activated CD8+ T cells in human TDLNs have a similar phenotype to tumor-infiltrating stem-like CD8+ T cells.

(A) Representative plots showing activated CD8+ T cells in human tumor and tumor-draining lymph nodes (TDLNs).
(B) Summaries of the proportion of stem-like CD8+ T cells in human kidney (n = 16), prostate (n = 32), and bladder (n = 12) tumors and kidney (n = 9) and prostate (n = 14) TDLNs.
(C) Phenotype of CD8+ T cell populations in TDLN and tumor.
(D) Summary of TCR repertoire overlap between activated CD8+ T cells from TDLNs and tumor-stem-like CD8+ T cells in human kidney and prostate cancer.
(E) TCR repertoire overlap in a representative patient between activated CD8+ T cells from TDLNs, stem-like CD8+ TILs, and TD CD8+ TILs. The proportion of the detected TCR clonotype in each patient that is unique or shared between the populations is shown. Summary showing the TCR overlap between stem-like and TD CD8+ TILs as a proportion of the LN CD8+ T cell repertoire.
(F) Sorted CTV-labeled activated CD8+ T cells from human TDLNs were cultured in vitro with anti-CD3/28/2 beads for 7 days.
(G) PCA of RNA-seq of naive CD8+ T cells, activated LN-stem CD8+, and stem-like CD8+ and TD CD8+ TILs.
(H) Gene expression patterns from K-means clustering of all CD8+ subsets. Gene set enrichment using genes from each cluster, compared with common effector CD8+ T cell signatures from yellow fever D14 and LCMV Arm.
(I) Normalized gene counts showing expression of selected genes in the sorted CD8+ T cell populations.
(J) Schematic of the number of methylated regions that are at least 25% different from naive in the TDLN and tumor CD8+ T cell populations. Black numbers show methylated regions, and blue numbers show demethylated regions.
(K) Specific methylation changes in TCF7. Traces show total methylation in regions. Boxed regions show significantly differentially methylated regions. Dot plots showed methylation of each CpG in boxed region. Median and 95% confidence intervals (CIs) are shown. *p < 0.05 determined by Mann-Whitney test.
