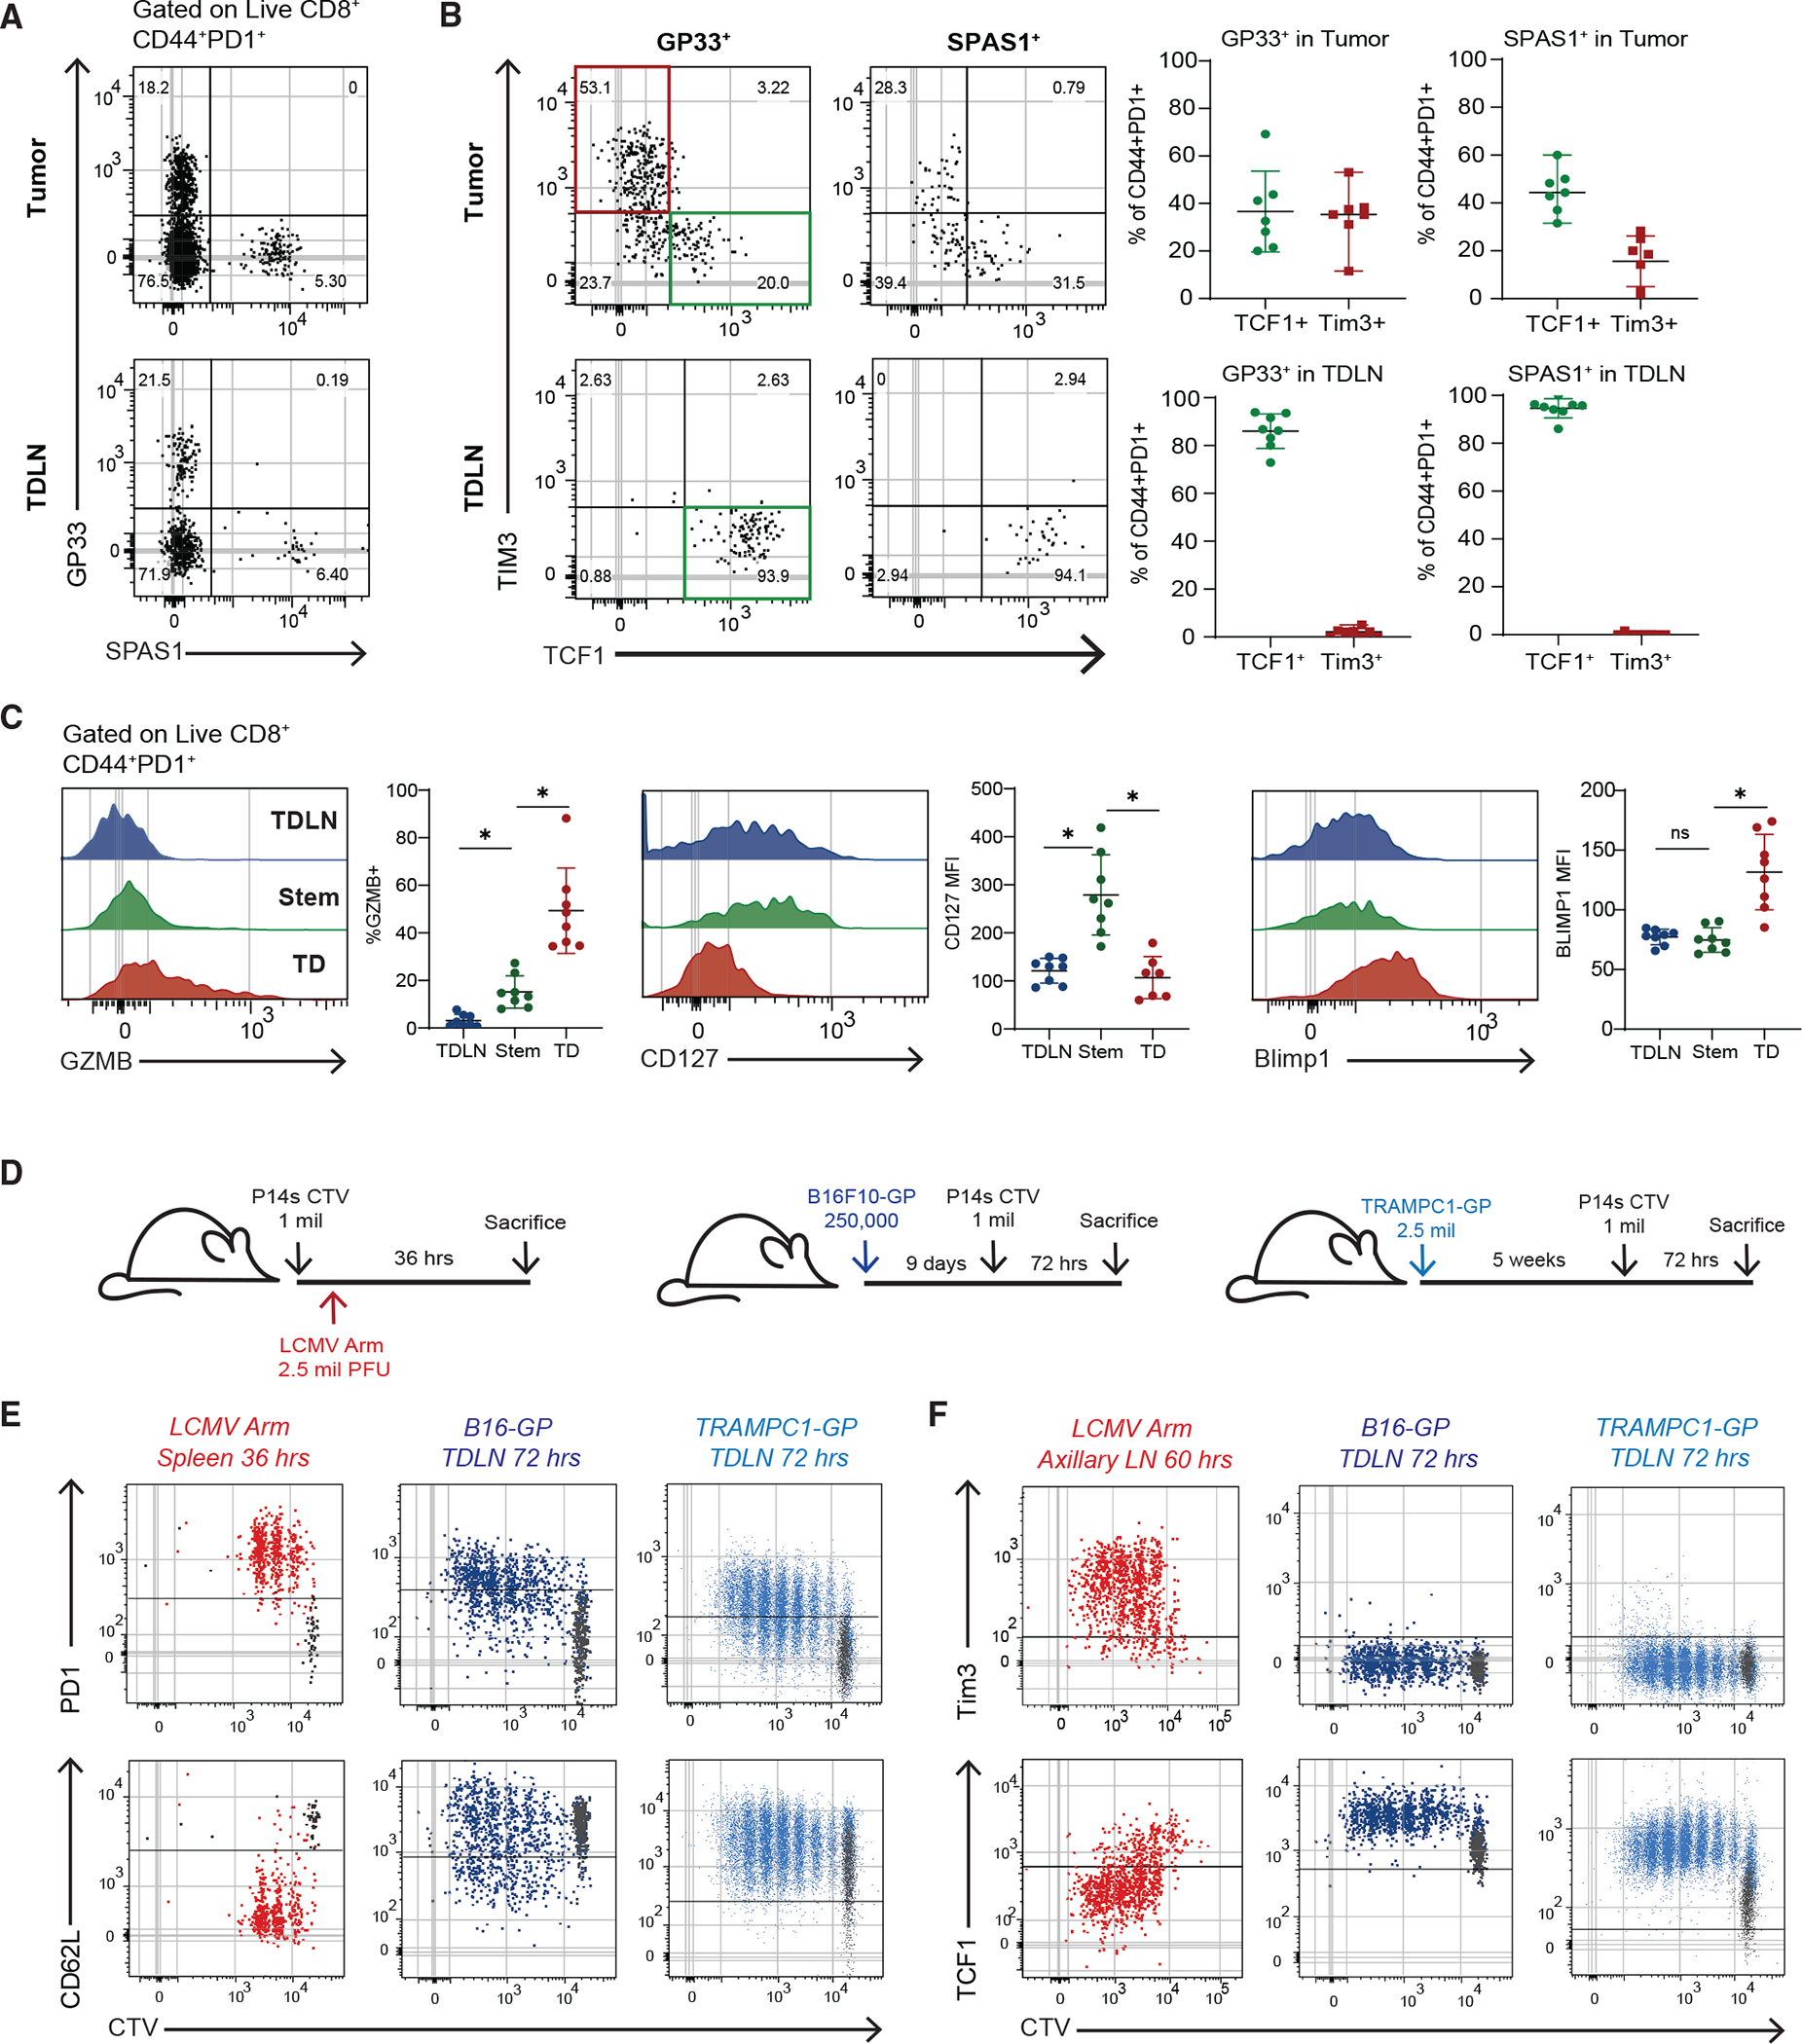
Figure 2. Tumor-specific CD8+ T cells activated in TDLNs to acquire a stem-like phenotype.

(A) Representative plot of tumor-specific CD8s in 5-week TRAMPC1-GP tumors and TDLNs.
(B) Phenotype of CD44+PD1+ tumor-specific CD8+ T cells in tumor and TDLN.
(C) Phenotype of CD44+PD1+ CD8+ T cell populations.
(D) Experimental setup of early activation of P14 CD8+ T cells.
(E) Flow cytometry of PD1 and CD62L expression by CTV of P14s activated in each respective model.
(F) Flow cytometry of TIM3 and Tcf1 expression by CTV of P14s activated in each respective model. Median and 95% confidence intervals (CIs) are shown. *p < 0.05 determined by Mann-Whitney test.
