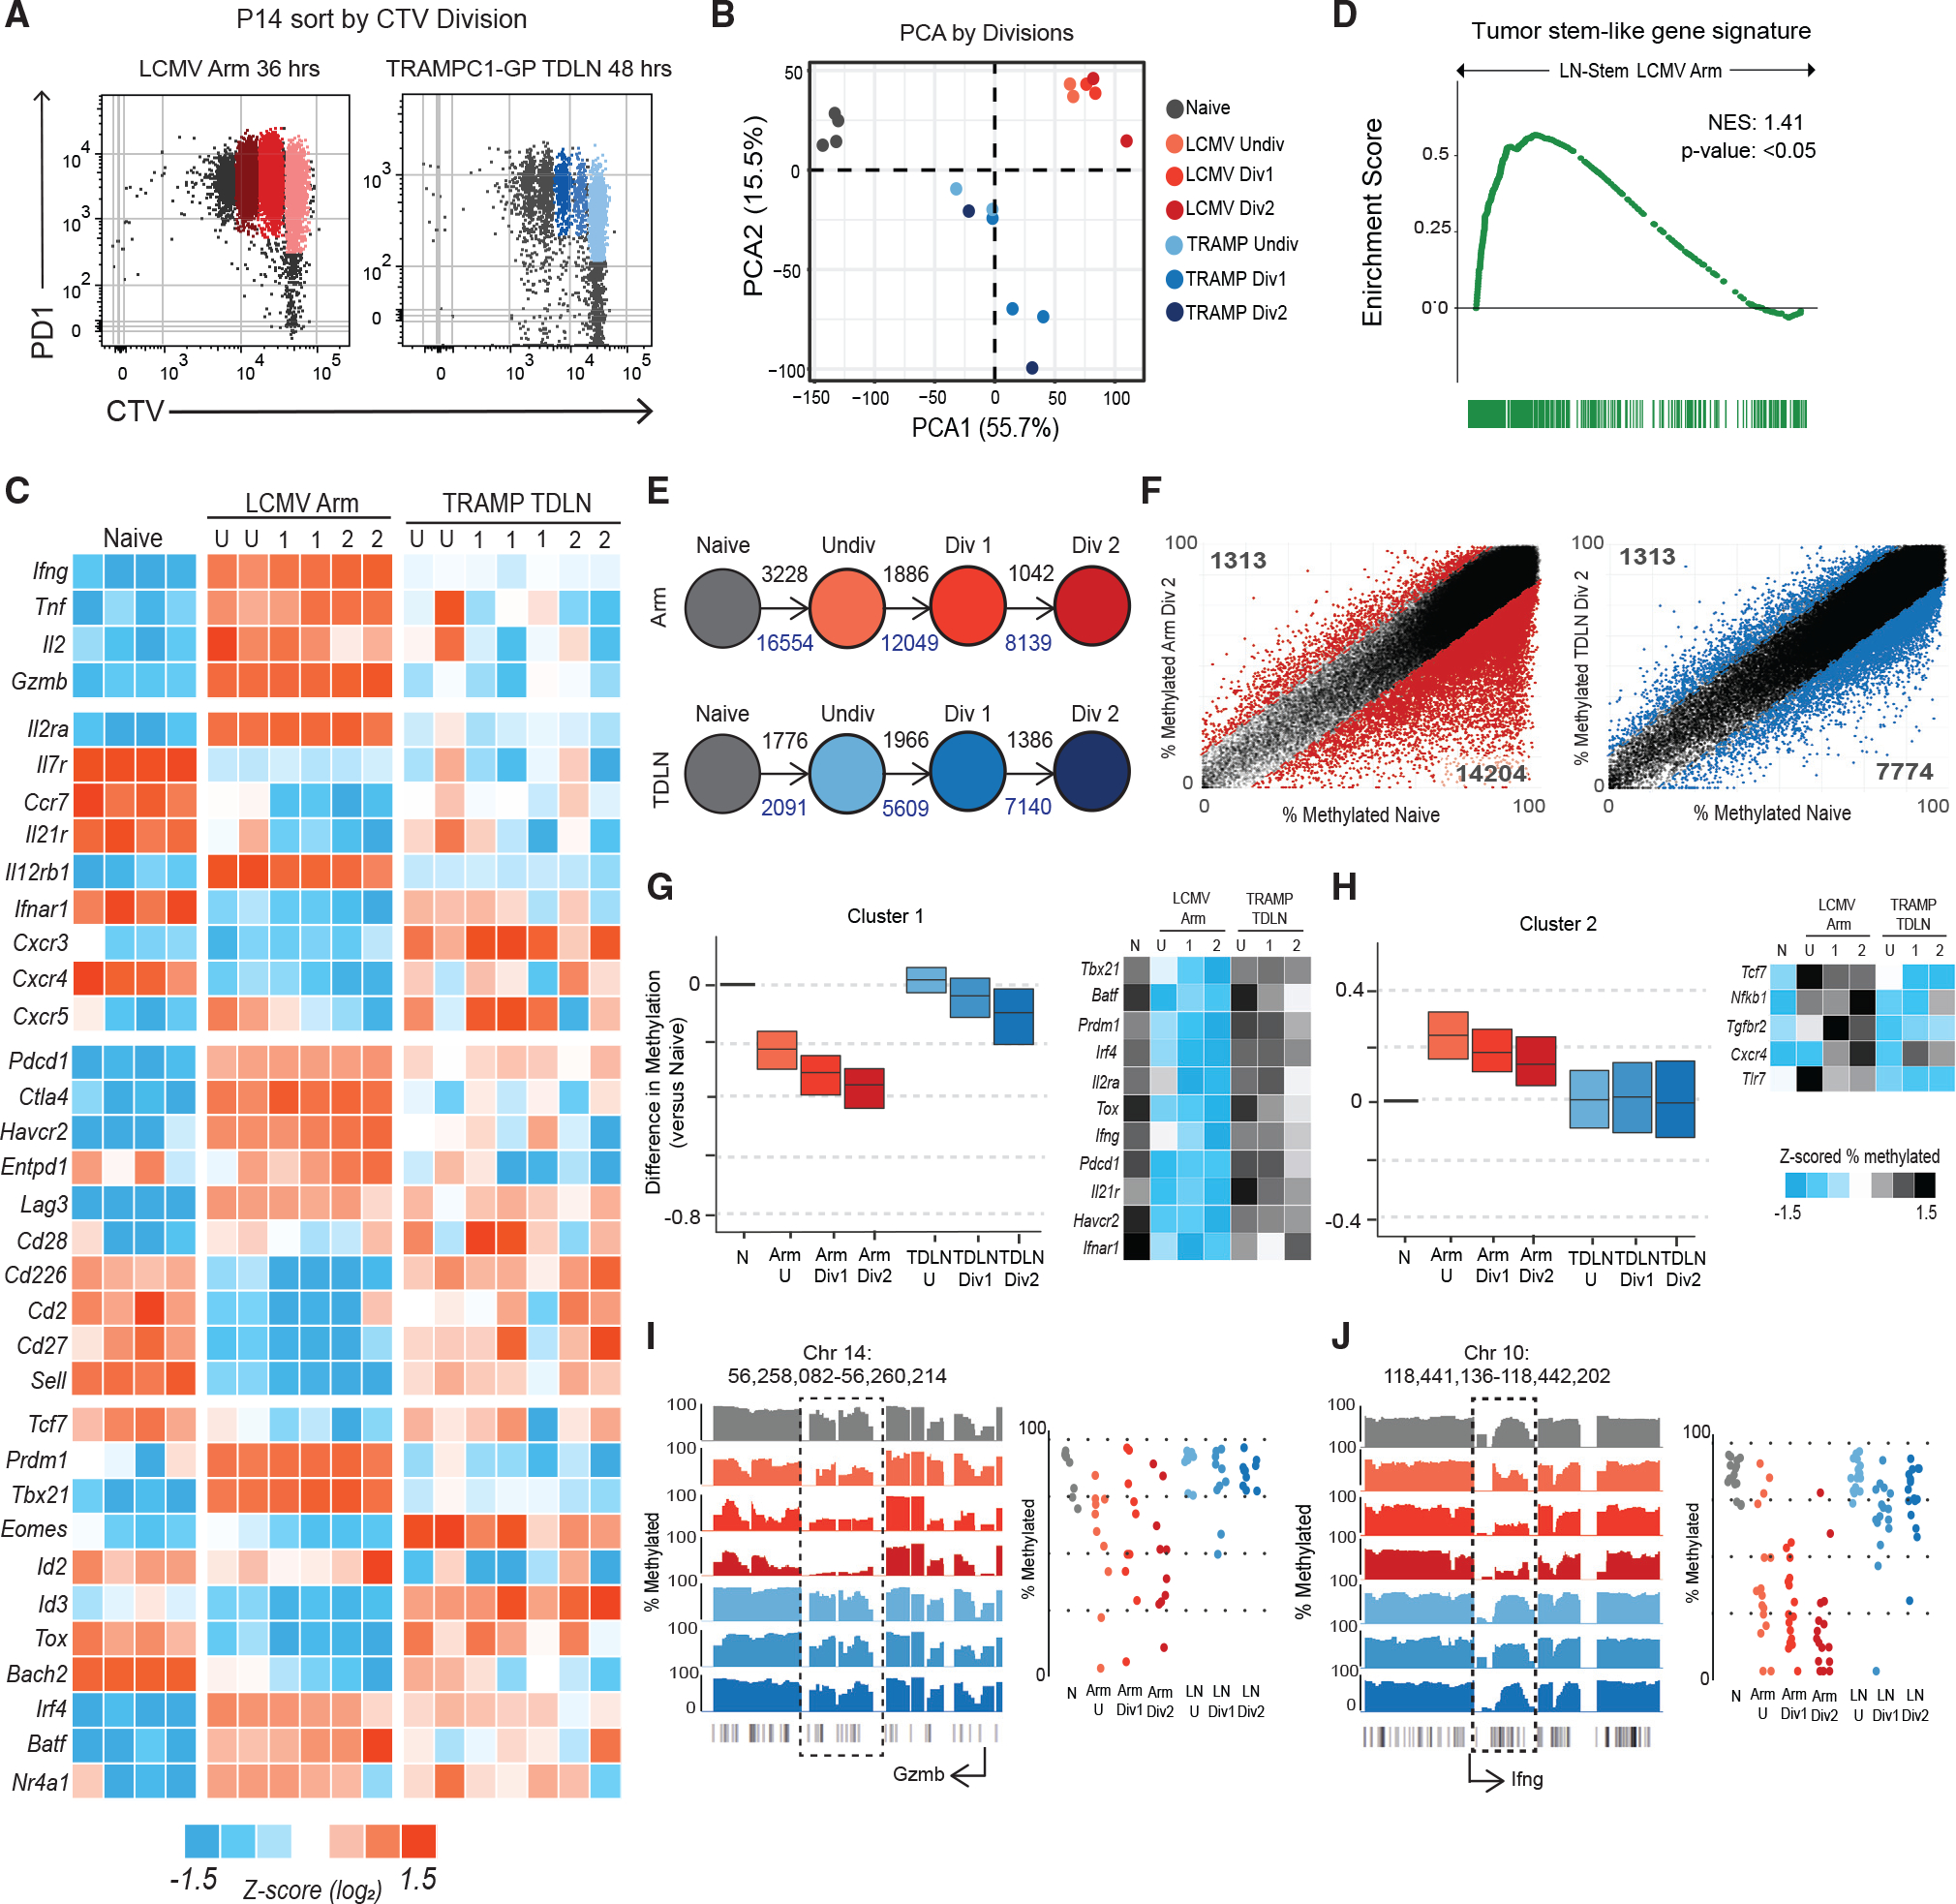
Figure 3. Tumor-specific CD8+ T cells activated in TDLNs do not acquire an effector transcriptional or epigenetic program.

(A) Sorting scheme to isolate P14s by division in LCMV Armstrong spleen and TDLNs from TRAMPC1-GP-bearing mice.
(B) PCA of naive P14s, P14s activated in LCMV Arm, and P14s activated in TRAMPC1-GP TDLNs by division.
(C) Heatmap of Z score log2 expression of selected genes.
(D) GSEA using the gene signature from mouse tumor-specific stem-like CD8+ T cells, compared with P14s from LCMV Arm and TDLN. Enrichment score is plotted.
(E) Schematic of number of regions with at least 15% difference in methylation from naive P14s, as P14s divide; black numbers represent methylated regions, and blue numbers represent de-methylated regions.
(F) Regions of methylation in P14s Div2 from either LCMV Arm or TRAMPC1-GP TDLN plotted versus naive P14s. Colored regions represent at least 15% difference in methylation, compared with naive P14s.
(G and H) Clustering using unbiased K-means of regions demethylated in P14s from LCMV Arm, compared with naive; the same regions were plotted in P14s from TRAMPC1-GP TDLNs. Cluster 1 shown in (G), Cluster 2 shown in (H). Heatmap of Z scored %methylation of select genes is shown.
(I and J) Traces show total methylation from 0% to 100% in regions near Gzmb (G) and Ifng (H). Boxed regions show significantly differentially methylated regions. Dot plots showed methylation of each CpG in boxed region.
