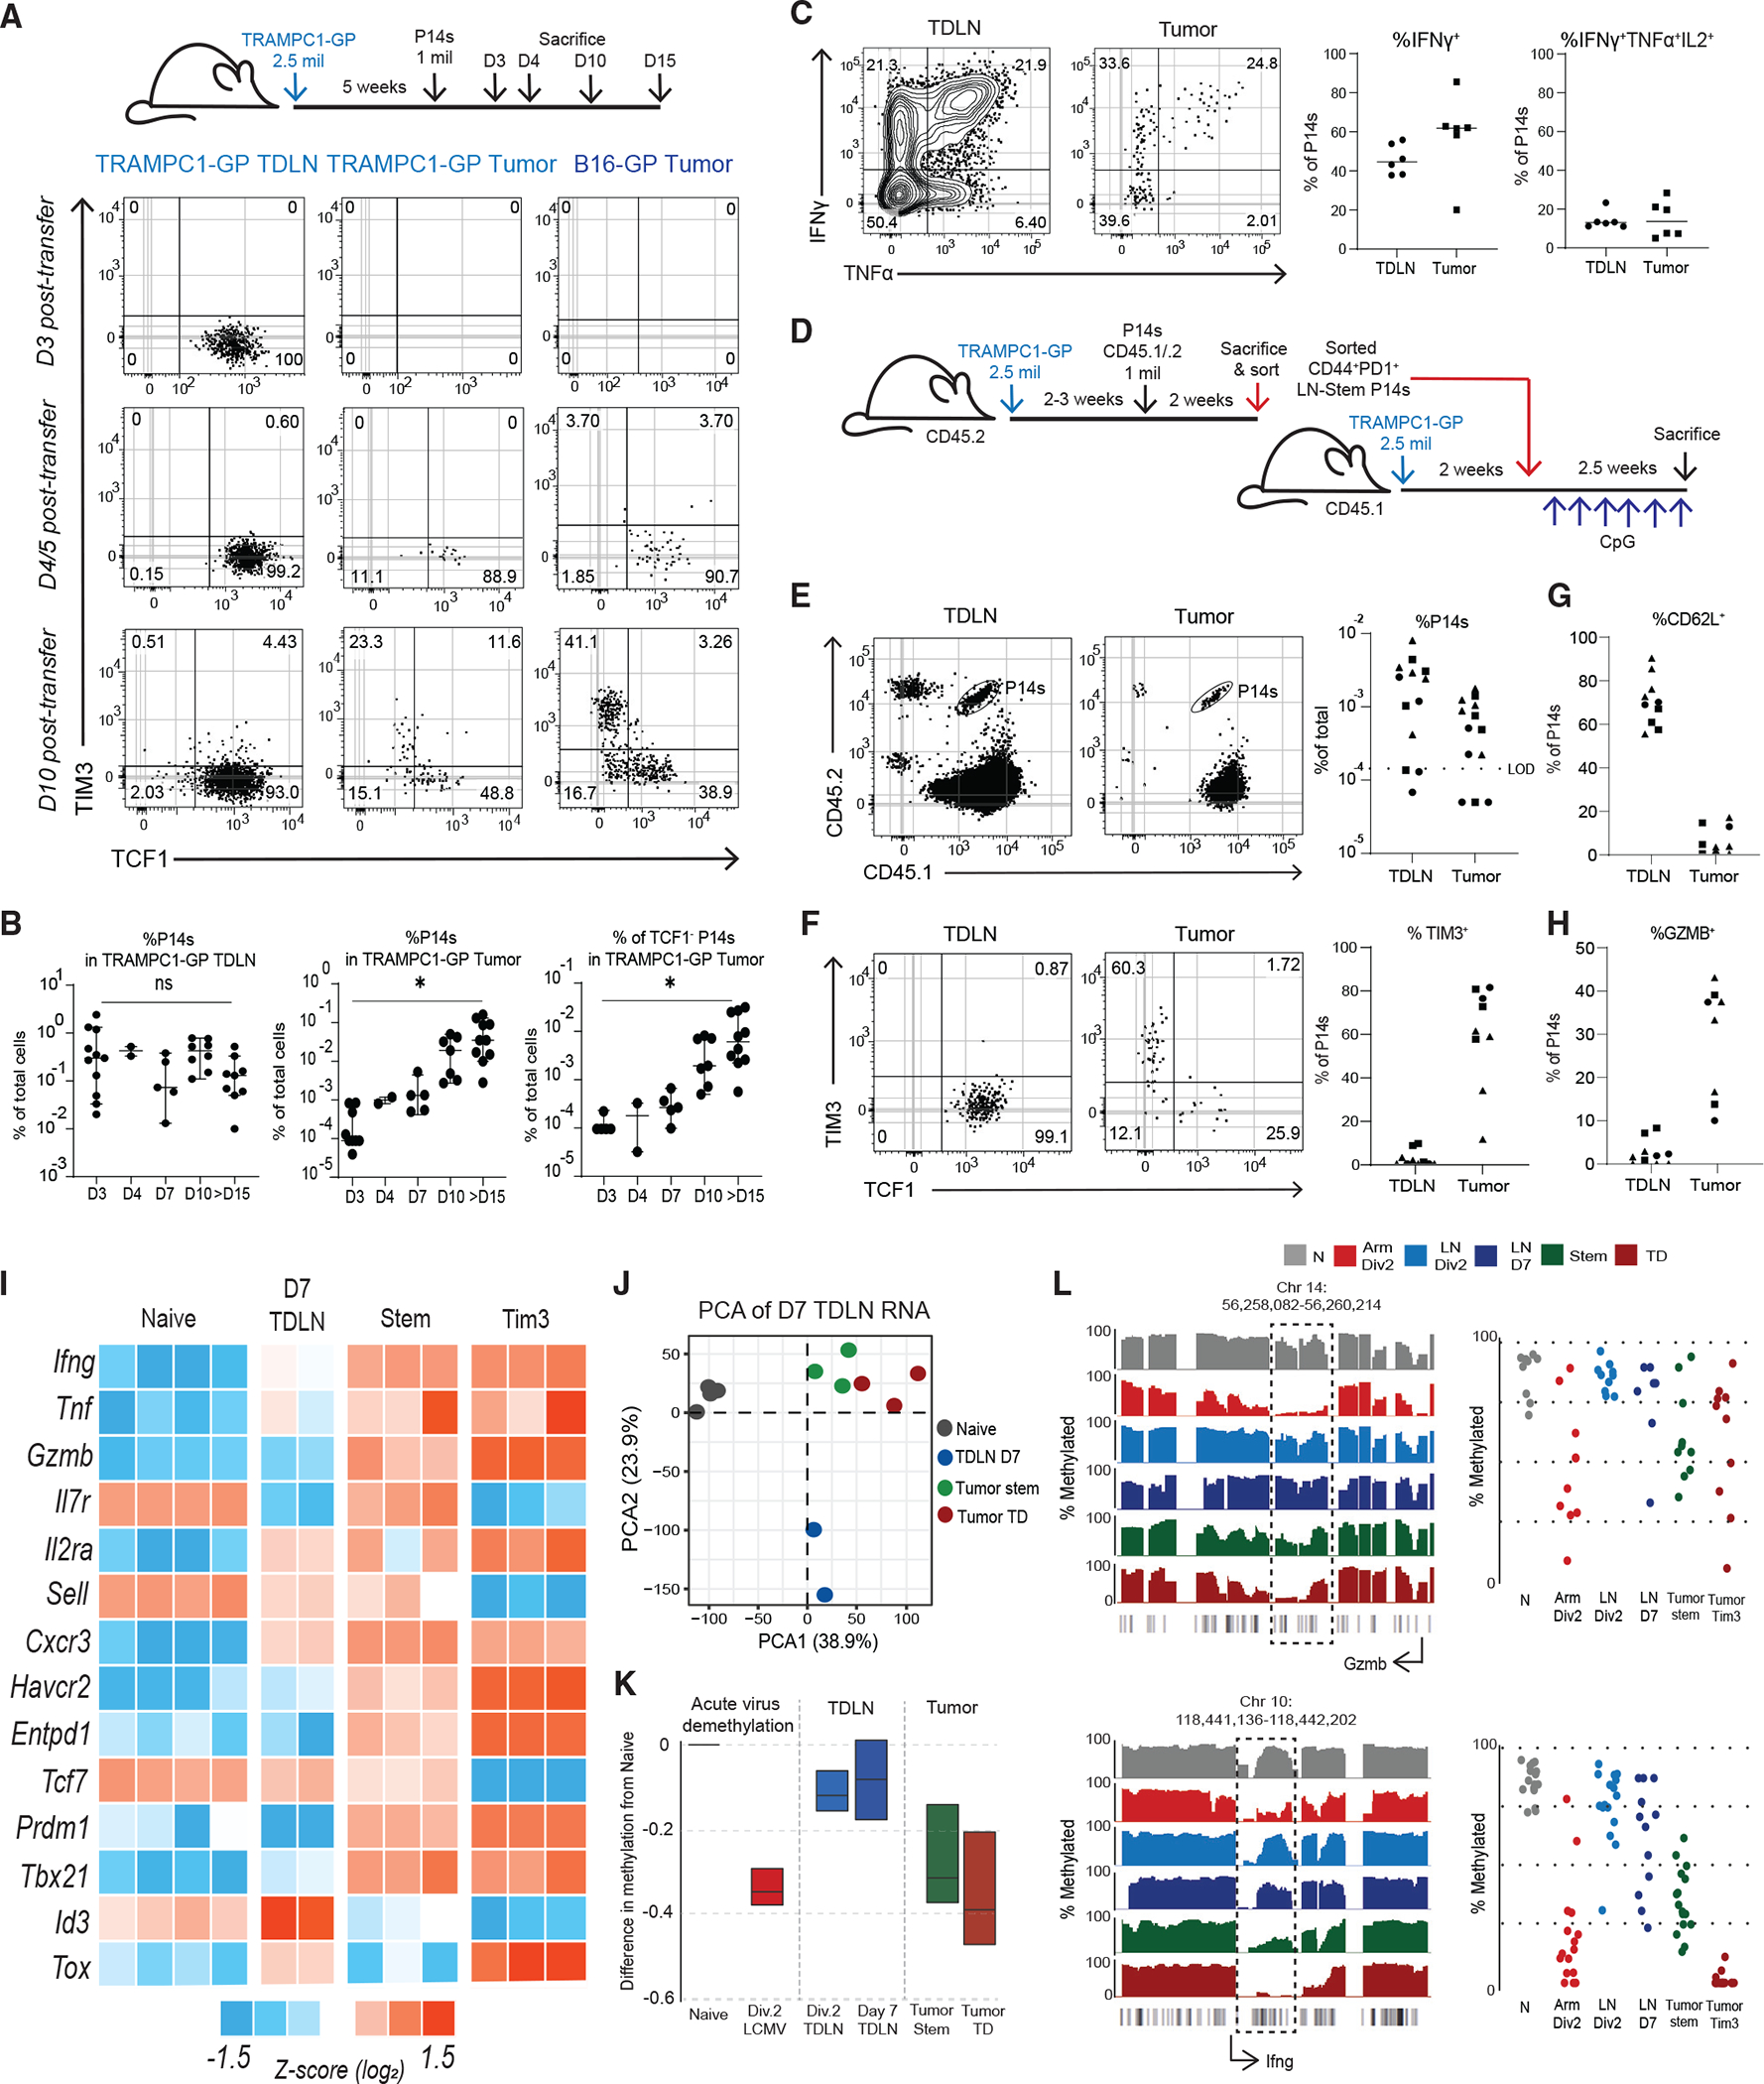
Figure 4. Tumor-specific CD8+ T cells only acquire effector phenotype after migration into the tumor.

(A) Experimental setup for P14 transfers to study kinetics of tumor infiltration. Analysis of P14 phenotype in both TRAMPC1-GP and B16-GP tumors over the time course. P14s gated on CD44+PD1+.
(B) Summaries of total P14s in TRAMPC1-GP TDLNs and tumors over time course.
(C) Representative flow cytometry of intracellular cytokine staining (ICCS) of IFNγ and TNF-α, gated on CD44+PD1+ P14s.
(D) Experimental setup for P14 TDLN re-transfer into tumor-matched mice.
(E) Flow cytometry gating of re-transferred P14s in TDLNs and tumors of congenically mismatched recipients.
(F) Analysis of phenotype of re-transferred P14s.
(G and H) Summary plot of CD62L (G) and GzmB (H) expression of re-transferred P14s. Different shapes (circle/square/triangle) indicate to which of the 3 separate experiments each sample belongs.
(I) Heatmap of Z scored log2 expression of genes in naive P14s, sorted activated P14s D7 post transfer from TRAMPC1-GP TDLNs, endogenous tumor-stem-like CD8s, and endogenous TD CD8s.
(J) PCA of T cell subsets.
(K) Analysis of differentially methylated regions, using previously defined cluster of genes demethylated in P14s from LCMV Arm (cluster 1, Figure 3G). Plot shows cluster 1 differentially methylated regions’ T cells from various conditions.
(L) Specific methylation changes in Gzmb and Ifng. Traces show total methylation from 0% to 100% in regions near both genes. Boxed regions show significantly differentially methylated regions. Dot plots show methylation of each CpG in boxed region. Median and 95% confidence intervals (CIs) are shown. *p < 0.05 determined by Mann-Whitney test.
