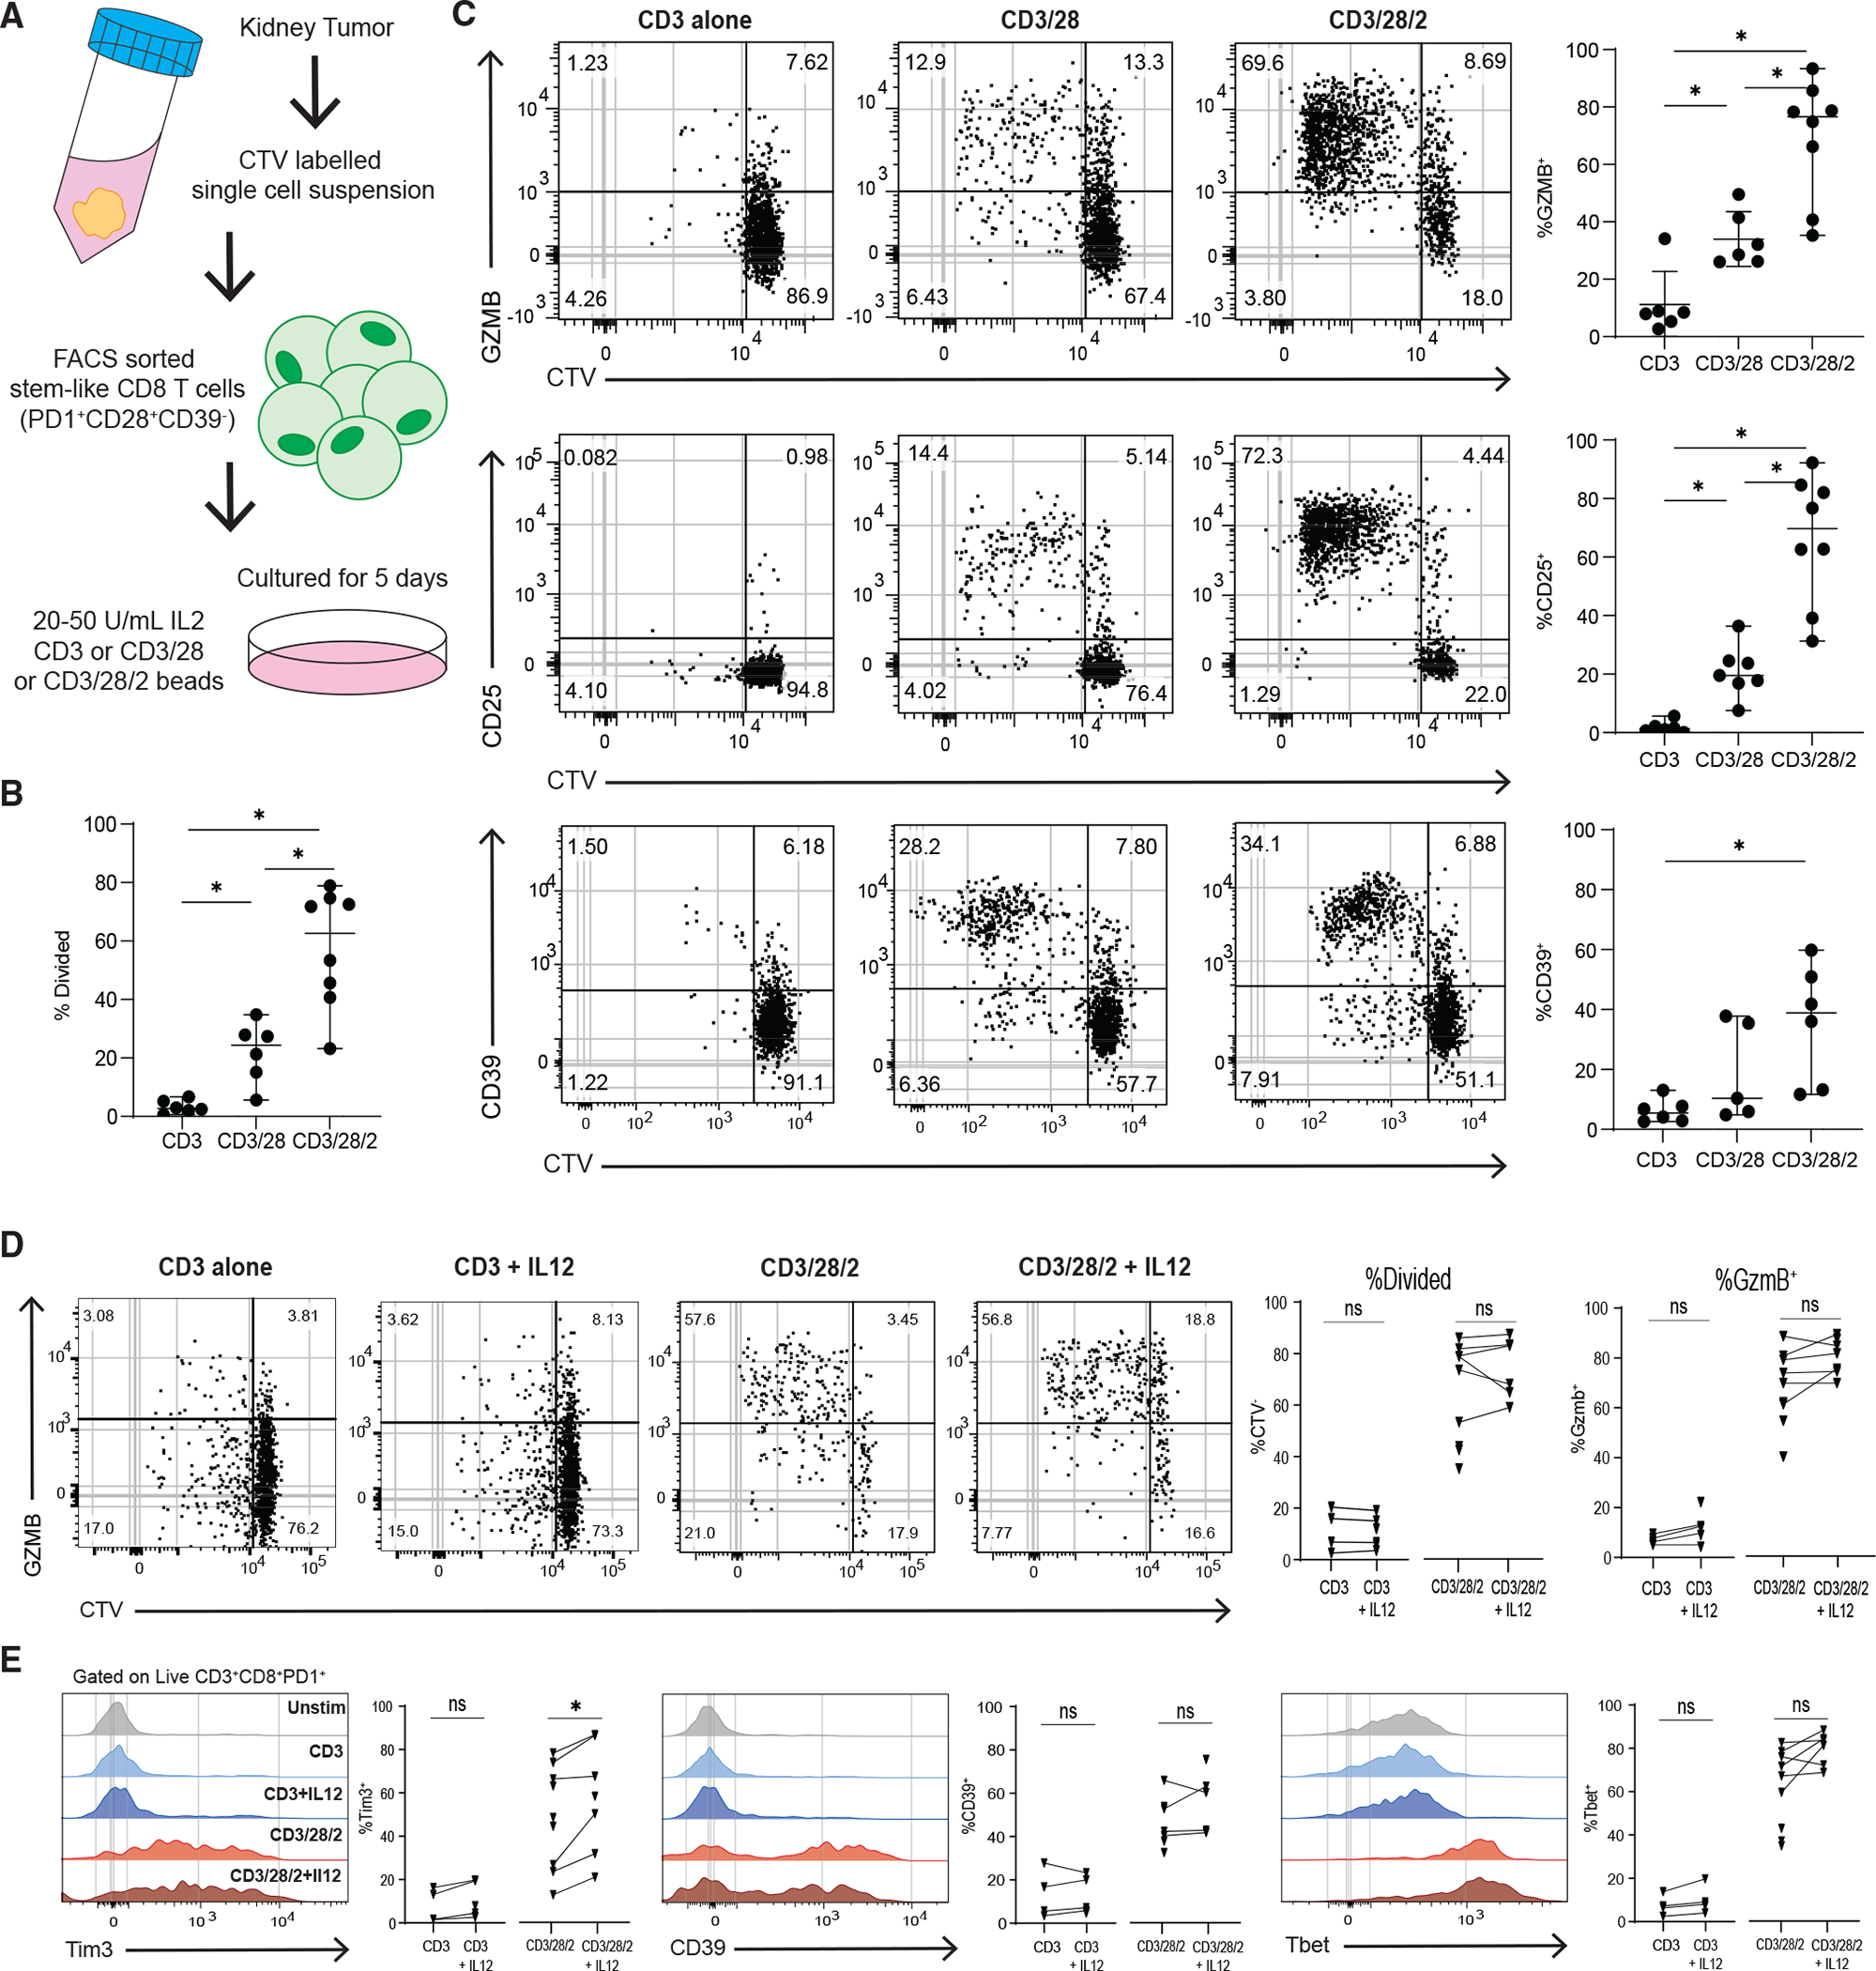
Figure 7. Co-stimulation is necessary for the differentiation of human tumor-stem-like CD8+ T cells.

(A) Experimental layout to test the requirement of co-stimulation to differentiate sorted tumor-stem-like CD8+ T cells.
(B) Summary plot shows the proportion of divided CD8+ T cells in each in vitro condition, based on CTV dilution.
(C) Representative plots showing CTV dilution and phenotype after 5 days of culture in each condition.
(D) Representative plots showing CTV dilution and expression of GZMB of control in vitro stimulations or with added IL-12.
(E) Histograms showing expression of TIM3, CD39, and Tbet for all conditions. Medians and 95% CIs are represented. *p < 0.05 determined by Mann-Whitney test. *p < 0.05 determined by Wilcoxon test when sufficient paired samples were analyzed, shown as connected by a line.
