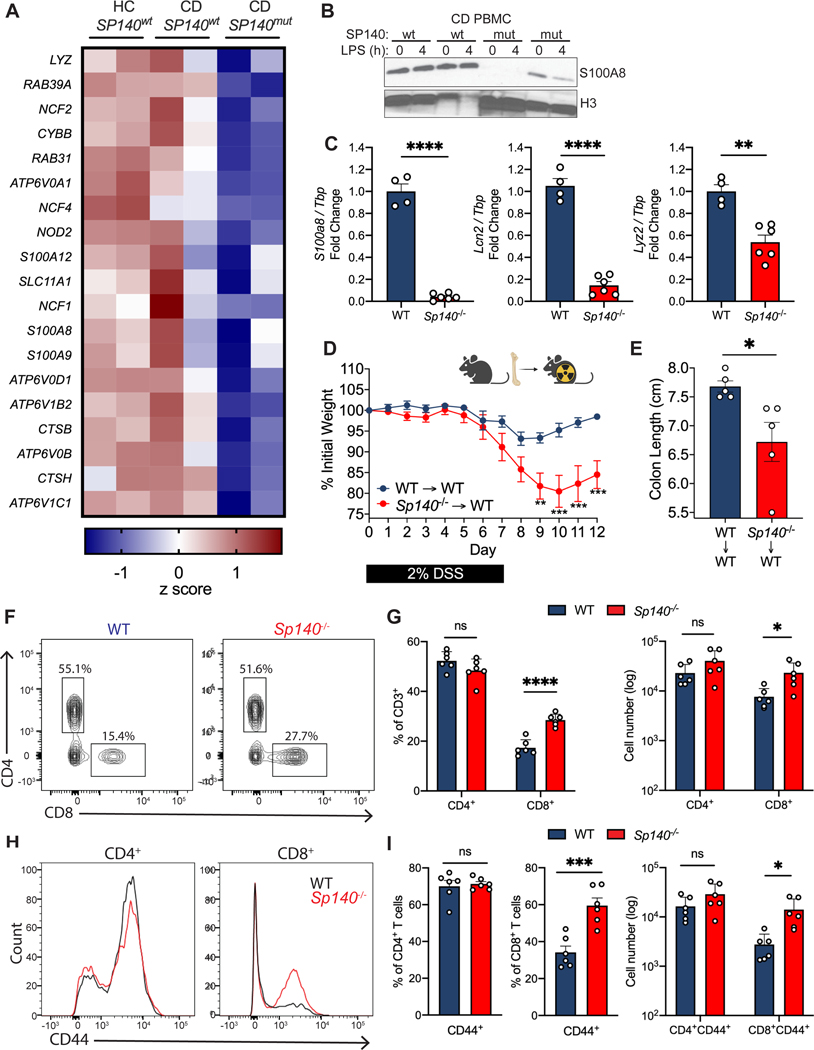
Figure 1. SP140 is essential for antimicrobial gene programs in mouse and human.
(A) Heat map of genes down-regulated (log2FC>2) in human peripheral blood mononuclear cells (PBMC) from healthy controls (HC), Crohn’s disease (CD) patients bearing wildtype SP140 (SP140wt) or CD-risk SP140 genetic variant (SP140mut) (n=2, RNA-seq) from GSE89876. (B) Immunoblot of S100A8 in PBMC from SP140wt or SP140mut CD patients after 0 or 4 hours LPS stimulation (100 ng/mL). (C) Expression of mouse S100a8, Lcn2, and Lyz2 mRNA relative to Tbp, as determined by qPCR, in mouse bone marrow-derived macrophages (BMDMs) from wildtype (WT) and Sp140−/− mice. (D) Daily body weight of WT and Sp140−/− mice and (E) quantification of day 12 colon lengths after 2% dextran sulfate sodium (DSS) administration (n=5). (F-I) Flow cytometry analysis of WT and Sp140−/− mouse colon lamina propria (n=6). (F) Representative flow cytometry plots of live CD45+CD3+ cells gated on CD4+ and CD8+ T cells. (G) Quantification of frequency and total count of CD4+ and CD8+ T cells. (H) Representative histogram overlay of CD44 expression in CD4+ and CD8+ T cells. (I) Quantification of frequency and total count of CD44+CD4+ and CD8+ T cells. Data are mean of 2–6 biological replicates. Error bars represent means ± SEM. n.s., not significant, *P<0.05, **P<0.01, ***P<0.001, ****P<0.0001; unpaired t tests for (C), (E), (F), (H), two-way ANOVA for (D).

