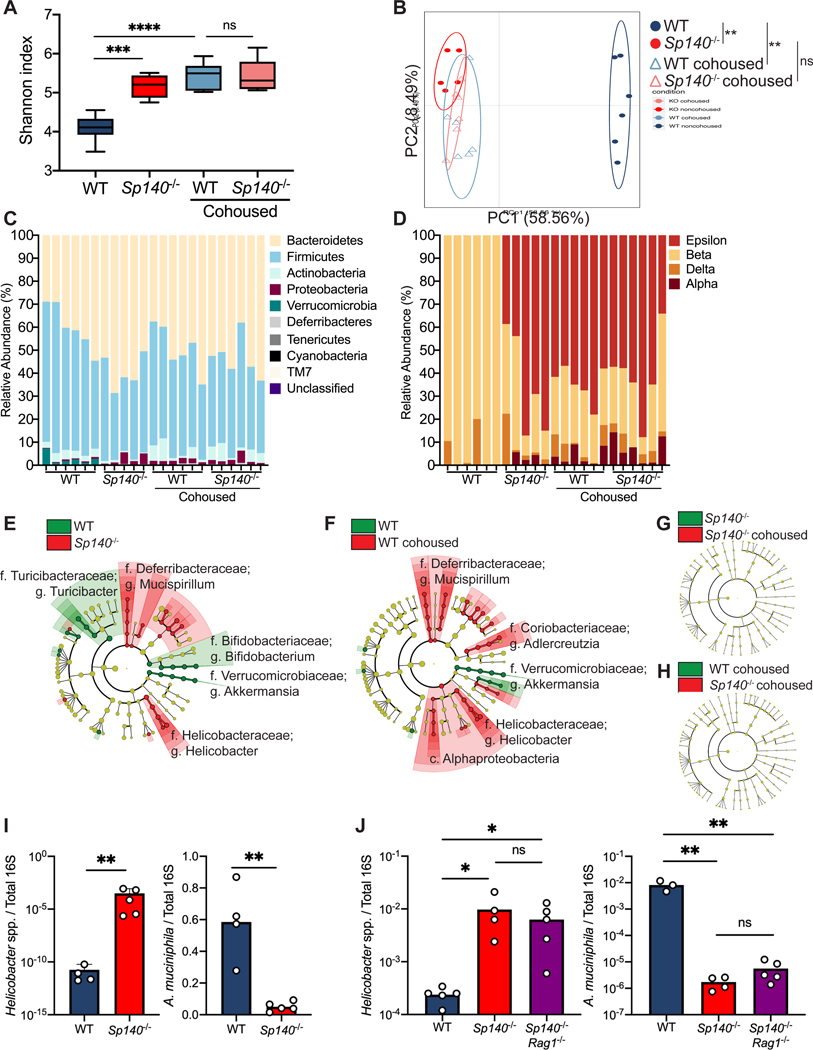
Figure 3. Sp140 deficiency in mice permits a Helicobacter bloom and a reduction in Akkermansia.
(A) Diversity of fecal bacterial communities of separately housed or cohoused wildtype (WT) and Sp140−/− mice as determined by Shannon Index. (B) Principal Coordinate Analysis (PCA), P<0.05, PERMANOVA on unweighted UniFrac distance. (C) Distribution of bacterial phyla operational taxonomic units presented as relative abundance in each sample. (D) Distribution of bacterial class operational taxonomic units presented as relative abundance of Proteobacteria in each sample. (E) The compositional differences between separately housed WT and Sp140−/− mice, (F) separately housed WT and WT cohoused with Sp140−/− mice, (G) separately house Sp140−/− and cohoused Sp140−/− mice, and (H) cohoused WT and Sp140−/− mice were determined by a linear discriminant analysis using LEfSe (https://huttenhower.sph.harvard.edu/galaxy/). (I) Expression of Helicobacter species (spp.) and Akkermansia muciniphila 16S rRNA relative to total 16S rRNA, as determined by qPCR, in stool from WT and Sp140−/− mice (n=4–5). (J) Expression of Helicobacter species (spp.) and Akkermansia muciniphila 16S rRNA relative to total 16S rRNA in stool from WT, Sp140−/−, and Sp140−/−Rag1−/− mice (n=3–5). Error bars represent means ± SEM. n.s., not significant, *P<0.05, **P<0.01, ***P<0.001, ****P<0.0001; (I) unpaired t tests. (A, J) one-way ANOVA.

