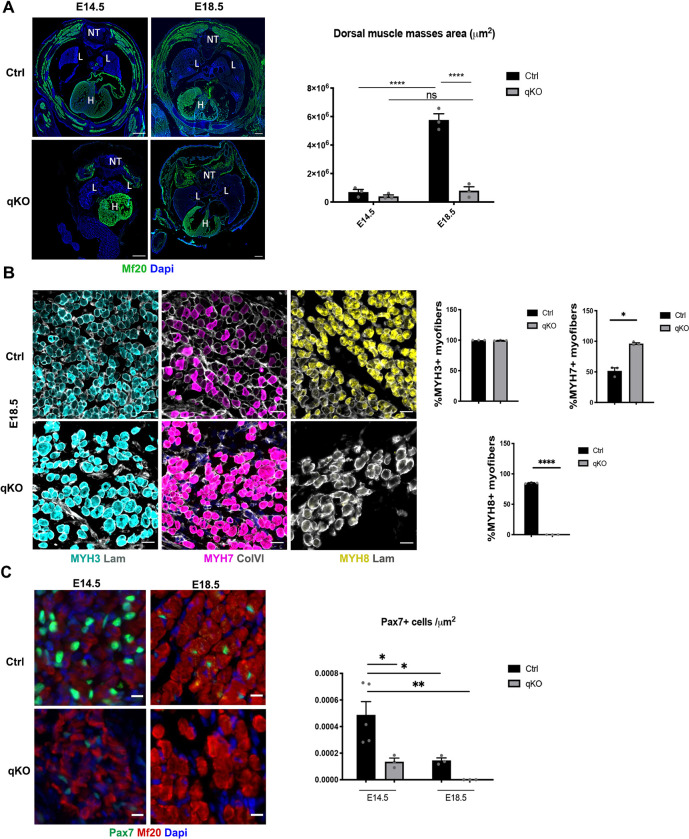
Fig 5. SIX homeoproteins are required for fetal myogenesis and for the maintenance of the myogenic progenitor’s pool.
(A) Left: Immunostainings on transverse trunk sections of E14.5 and E18.5 Ctrl and qKO (n = 3) fetuses at the trunk level showing sarcomeric myosins marked by MF20 (green) and Dapi (blue); NT: Neural Tube, L: Lungs, H: Heart, Sb = 300μm. Right: Quantification of the MF20+ muscle mass area (μm2) at the dorsal level of E14.5 and E18.5 Ctrl and qKO (n = 3) fetuses; two-way ANOVA statistical test with mean ±s.e.m and **** p<0.0001. (B) Left: Immunostainings on transverse trunk sections of E18.5 Ctrl and qKO (n = 3) fetuses showing the different types of myosins in the dorsal muscle masses area; MYH3 (Cyan), MYH7 (Magenta), MYH8 (Yellow), Laminin (Grey), Sb = 20μm. Right: Quantification of the percentage of MYH+ myofibers in Ctrl and qKO dorsal muscle masses; statistical paired t-test with mean ±s.e.m and *p<0.05 **** p<0.0001 (C) Left: Immunostainings on transverse trunk sections of E14.5 and E18.5 Ctrl and qKO (n = 3) fetuses at the trunk level showing on the dorsal muscle masses sarcomeric myosins marked by MF20 (red), Pax7 (green) and Dapi (blue); Sb = 10μm. Right: Quantification of the number of Pax7+ cells per μm2 on the dorsal muscle masses of E14.5 and E18.5 Ctrl and qKO (n = 3) fetuses; two-way ANOVA statistical test with mean±s.e.m and * p<0.05 **p<0.005.

