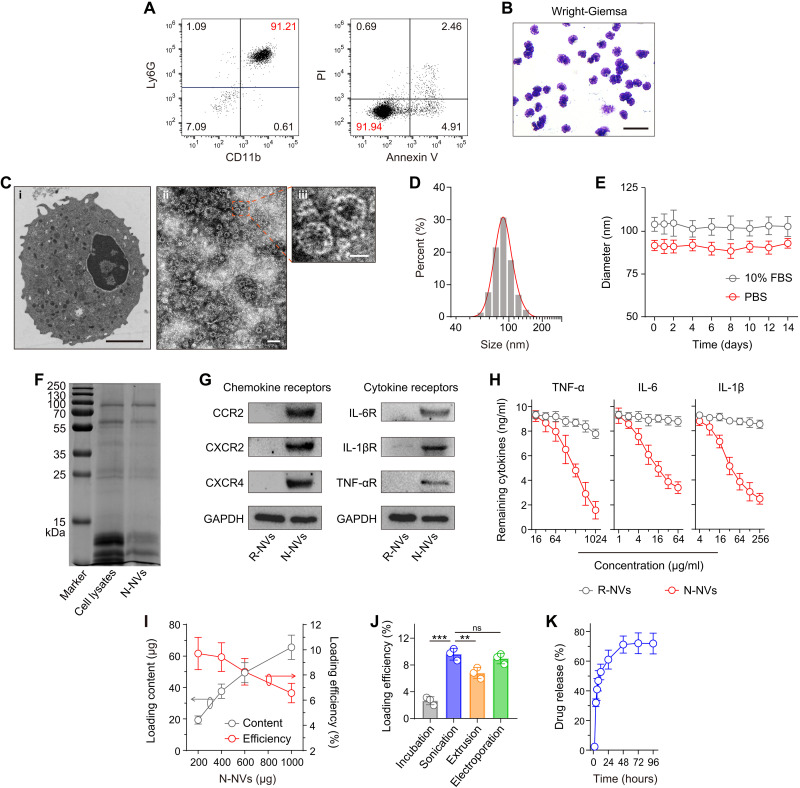
Fig. 2. Preparation and characterization of DEX-N-NVs.
(A) Flow cytometric analysis of neutrophil purity and apoptosis. (B) Wright-Giemsa staining of neutrophils. Scale bar, 50 μm. (C) Transmission electron microscopy (TEM) images of (i) neutrophils and (ii and iii) N-NVs. Scale bars, (i) 2 μm, (ii) 200 nm, and (iii) 50 nm. (D) Size distribution of N-NVs. (E) Stability of N-NVs in phosphate-buffered saline (PBS) and 10% fetal bovine serum (FBS) over 14 days. (F) SDS-PAGE protein analysis of neutrophil lysates and N-NVs. (G) Western blot analysis of chemokine and cytokine receptors including C-C motif chemokine receptor 2 (CCR2), C-X-C motif chemokine receptor 2 (CXCR2), CXCR4, IL-6 receptor (IL-6R), IL-1βR, and tumor necrosis factor–α receptor (TNF-αR) in red blood cell–derived NVs (R-NVs) and N-NVs. (H) Binding capacity analysis of R-NVs and N-NVs with TNF-α, IL-6, and IL-1β. (I) Drug loading content and efficiency of DEX into N-NVs after sonication. (J) Drug loading efficiency with different loading strategies. The initial N-NVs are 200 μg. (K) Drug release profile of DEX-N-NVs. All data are presented as means ± SD (n = 3). Statistical significance was calculated via ordinary one-way analysis of variance (ANOVA) with Dunnett’s test (J). **P < 0.01 and ***P < 0.001. GAPDH, glyceraldehyde-3-phosphate dehydrogenase; ns, not significant.

