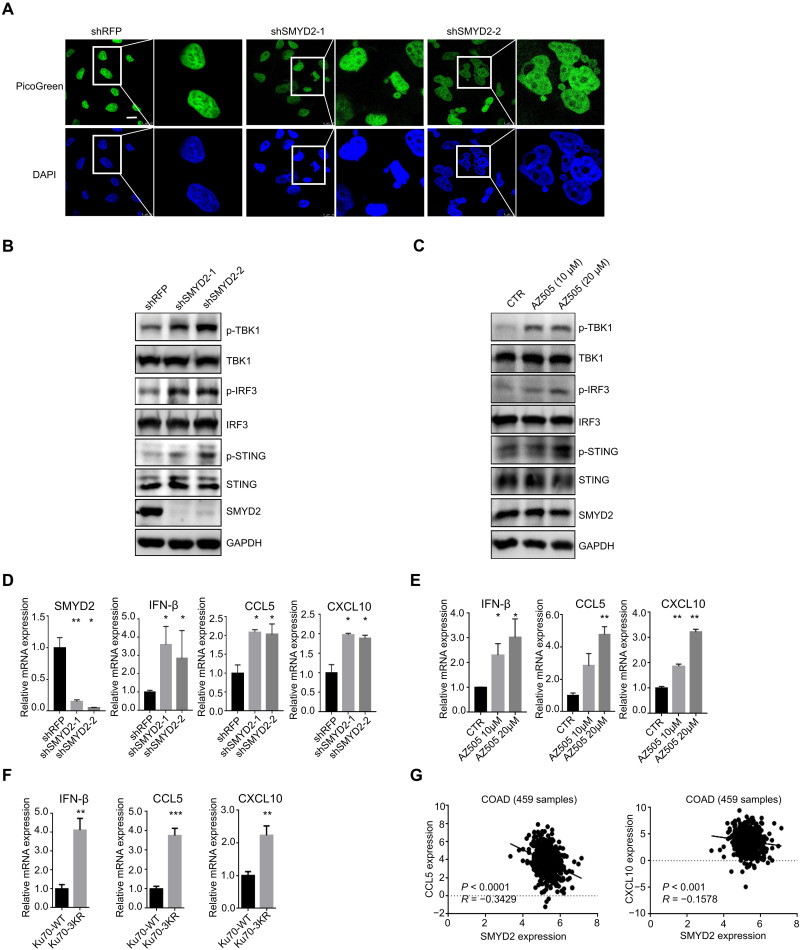
Fig. 4. Inhibition of SMYD2 activates the cGAS-STING pathway.
(A) Representative fluorescence images and quantification of cytosolic DNA in cells with and without SMYD2. Scale bars, 10 μm. Green, PicoGreen; blue, DAPI. DNA was detected using the PicoGreen fluorescence dye selectively binding dsDNA. (B) Immunoblot of markers in the STING pathway including total and phospho-TBK1 (p-TBK1) (S172), total and p-IRF3 (S396), and total and p-STING (S366) in lysates collected from cells with and without SMYD2 in HCT116 cells. (C) Immunoblot of markers in the STING pathway including total and p-TBK1 (S172), total and p-IRF3 (S396), and total and p-STING (S366) in lysates collected from HCT116 cells with and without SMYD2 inhibitor AZ505 at 10 and 20 μM for 7 days. (D) The expression of SMYD2, IFN-β, CCL5, and CXCL10 were measured via quantitative polymerase chain reaction (qPCR) in cells with and without SMYD2 in HCT116 cells. (E) The expression of IFN-β, CCL5, and CXCL10 were measured via qPCR in cells with and without SMYD2 inhibitor AZ505 at 10 and 20 μM in HCT116 cells. (F) The expression of IFN-β, CCL5, and CXCL10 were measured via qPCR in cells with Ku70-WT or 3KR mutant in HCT116 cells. The cells were transfected with FLAG-Ku70 WT/3KR lentivirus with puromycin selection. (G) The correlation of SMYD2 with CCL5 or CXCL10 expression in TCGA colon adenocarcinoma (COAD) database. The primary data were downloaded from the TISIDB website.

