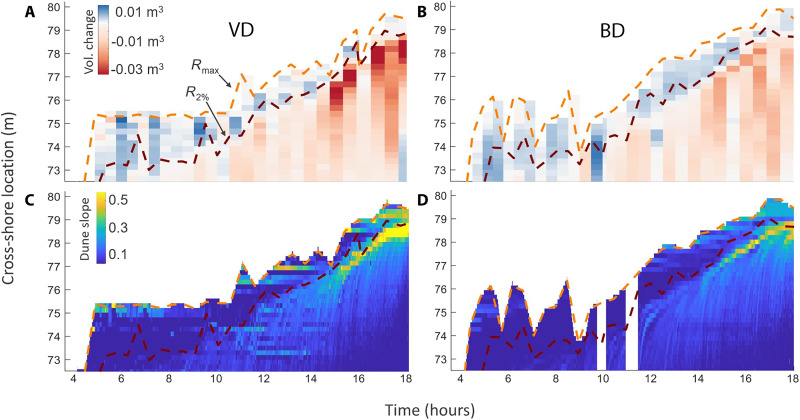
Fig. 2. Wave run-up extent, accretion and erosion patterns, and micro-slope formation on the dunes over time.
(A) VD maximum run-up distance (Rmax), R2% run-up distance, and accretion-erosion patterns over the course of the storm. (B) BD Rmax distance, R2% distance, and accretion-erosion patterns. (C) VD micro-slopes over the course of the storm. (D) BD micro-slopes over the course of the storm. In (D), the white space around 10 and 11.5 hours on the y axis indicates data gaps. Axes for all graphics: The x axis ranges from the time that waves first encountered the vegetation (at 4 hours) until the peak of the storm conditions. The y axis ranges from the cross-shore location where the vegetation began at the dune toe (72.5 m) and extended landward to the dune peak (80 m).

