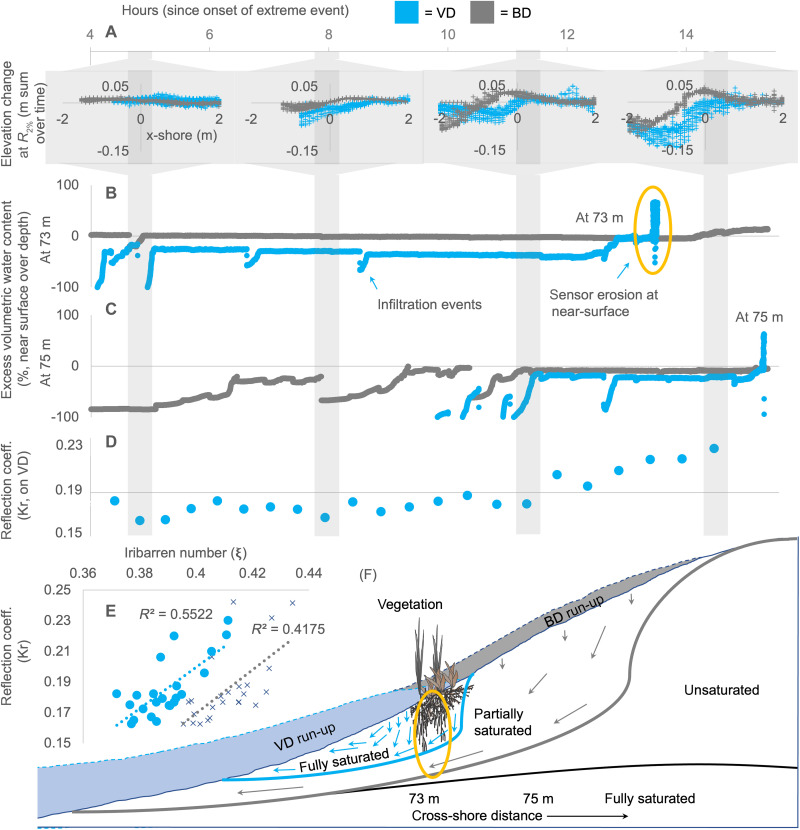
Fig. 3. Dune erosion, water content and infiltration, and wave reflection over time.
(A) Erosion and accretion at the R2% line at 4.8, 7.9, 11.3, and 14.4 hours into the storm. The x axis for each subgraphic is the cross-shore distance from the R2% line, and the y axis is the summed change per time period. (B and C) Excess volumetric water content across time, near surface at 73 m, and at 75 m in the cross-shore direction, respectively. The x axis is continuous time in hours. Positive values on the y axis refer to near-surface volumetric water content exceeding that at depth, negative values vice versa. (D) Wave reflection across time highlighting the apparent transition at 11.3 hours on VD. (E) Wave reflection for VD and BD as a function of the Iribarren number; VD = 1.4x − 0.4, R2 = 0.42, blue circles; BD = 1.3x − 0.3, R2 = 0.55, black crosses. (F) The vegetation retarded wave run-up and concentrated water volume, supersaturating the sand and promoting instability.

