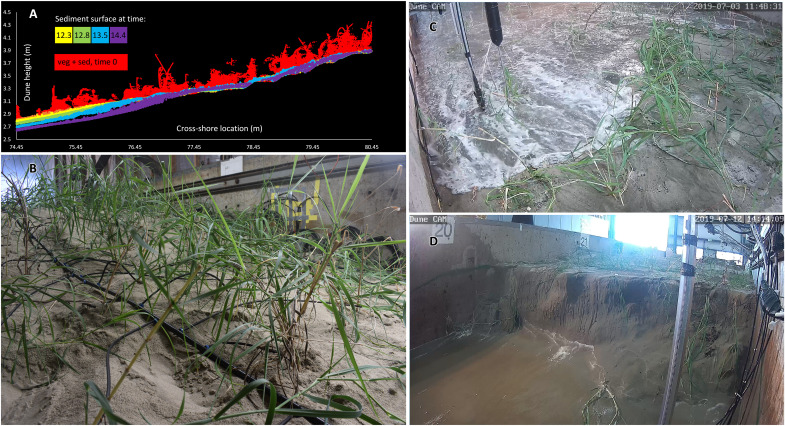
Fig. 4. Morphologic changes on VD during the extreme storm event.
(A) An example of Terrestrial Laser Scanning (TLS) data for the VD profile, viewed from the cross-shore dimension (i.e., the side), at 0, 12.3, 12.8, 13.5, and 14.4 hours into the storm conditions. The red points depict both the vegetation and the sediment surface before the experiment began at 0 hours. The other colors depict the sediment surface only, between 12.3 and 14.4 hours. By 14.4. hours, an initial 0.1-m tall scarp was apparent at ~76.5 m. (B) P. amarum plants on VD before the experiment began at 0 hours. Drip line (black hose) was removed during experimentation. (C) Run-up intercepting plants on VD at 11.3 hours. The depicted sensor array included an optical sediment gauge, sediment movement sensor, ultrasonic sensor, and acoustic velocimeter. (D) A 0.79-m tall scarp on VD at 18.4 hours.

