. 2023 May 15;12:e82593. doi: 10.7554/eLife.82593

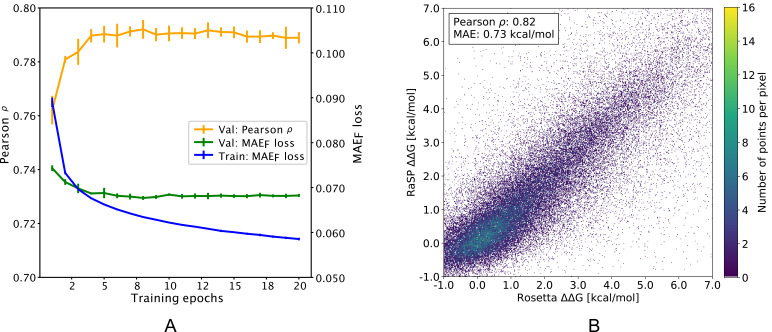
Figure 2. Overview of RaSP downstream model training and testing.

(A) Learning curve for training of the RaSP downstream model, with Pearson correlation coefficients (ρ) and mean absolute error (MAEF) of RaSP predictions. During training we transformed the target ΔΔG data using a switching (Fermi) function, and MAEF refers to this transformed data (see Methods for further details). Error bars represent the standard deviation of 10 independently trained models, that were subsequently used in ensemble averaging. Val: validation set; Train: training set. (B) After training, we applied the RaSP model to an independent test set to predict ΔΔG values for a full saturation mutagenesis of 10 proteins. Pearson correlation coefficients and mean absolute errors (MAE) were for this figure computed using only variants with Rosetta ΔΔG values in the range [–1;7] kcal/mol.
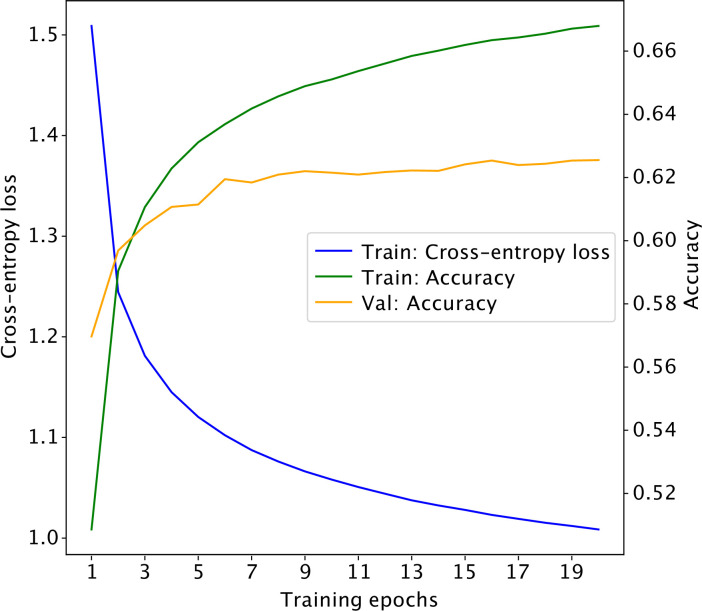
Figure 2.

Figure 2—figure supplement 1. Learning curve for the self-supervised 3D convolutional neural network.

Figure 2—figure supplement 1.

The model obtained at epoch 15 achieves a classification accuracy of 63% on the validation set.
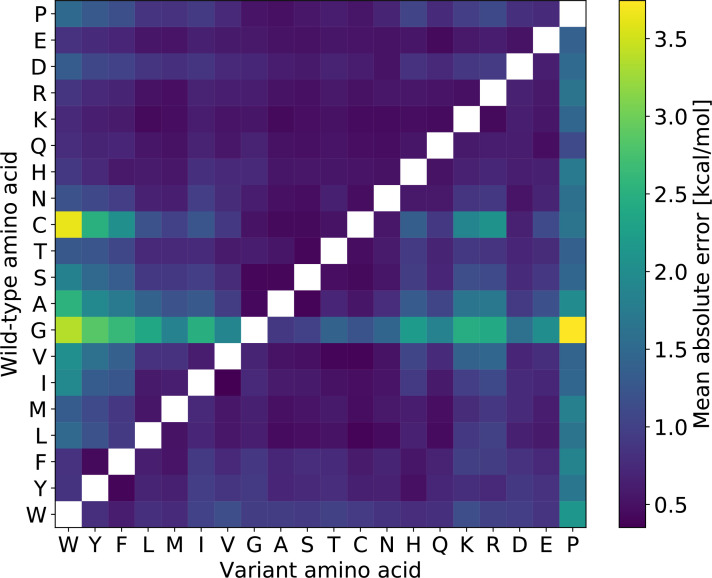
Figure 2—figure supplement 2. Mean absolute prediction error for RaSP on the validation set, split by amino acid type of the wild-type and variant residue.

Figure 2—figure supplement 2.

Substitutions from glycine and cysteine as well as to proline generally have higher errors.
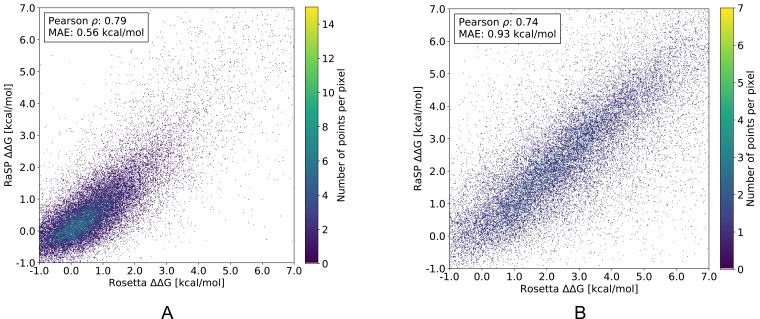
Figure 2—figure supplement 3. RaSP versus Rosetta ΔΔG values for a full saturation mutagenesis of 10 test proteins separated into either exposed (A) or buried (B) residues.

Figure 2—figure supplement 3.

We speculate, that the RaSP prediction task is harder in the case of buried residues because Rosetta ΔΔG values generally have higher variance in those regions. Pearson correlation coefficients and mean absolute errors (MAE) were for this figure computed using only variants with Rosetta ΔΔG values in the range [–1;7] kcal/mol. Buried and exposed residue were classified based a relative surface accessible surface area (SASA) cut-off of 0.2.