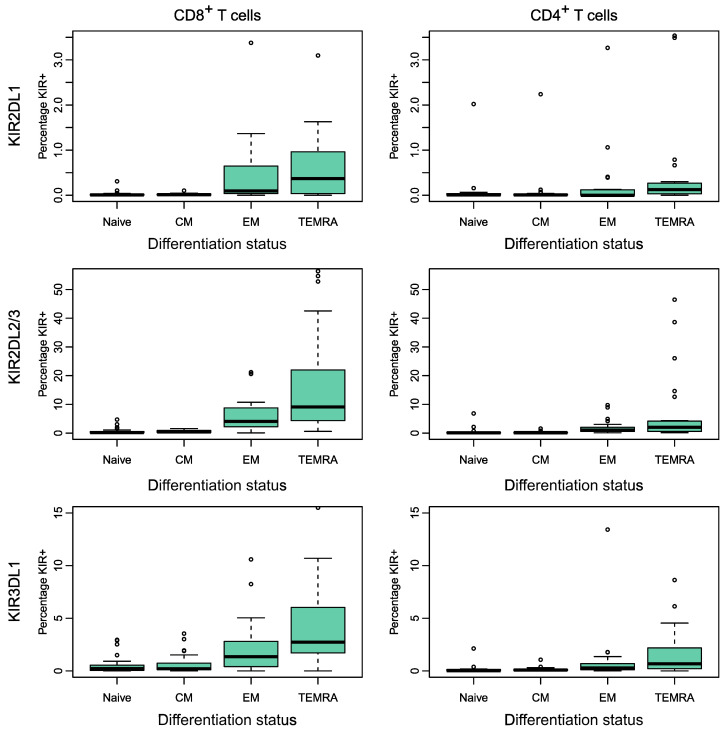
Figure 2. Percentage of T cells expressing different inhibitory KIRs (cohort 1).
The percentage of cells in each subpopulation that expressed each of 3 different iKIRs was quantified by flow cytometry for the participants in cohort 1 (n = 23). Multivariate regression analysis found that the following were highly significant predictors of increased iKIR expression: a more advanced cell differentiation stage (expressed as an ordinal), P = 4 × 10–14, CD8 coexpression P = 0.0007 and KIR2DL2/L3 P = 4 × 10–12; male sex was weakly predictive (P = 0.049). CMV serostatus and infection status were not significant predictors of iKIR expression. Note that the scale of the y axis is different between the rows. Boxes show the median and IQRs. The corresponding data are provided in Supplemental Table 1, and the details of the multivariate regression are given in Supplemental Table 2. n = 7 hypotheses tested. P value threshold for α = 0.05 is P = 0.009 (permutation test).

