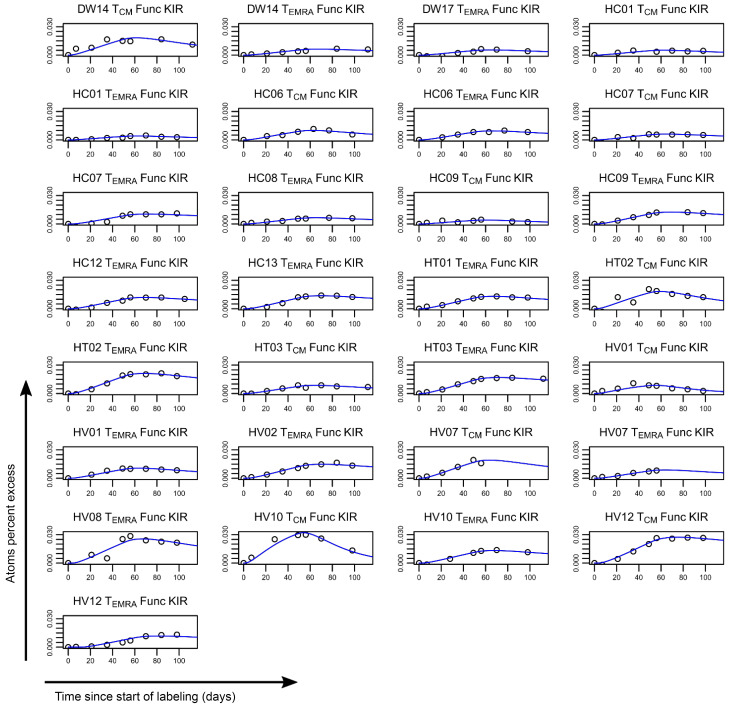
Figure 3. Label enrichment in CD8+ T cell subpopulations expressing functional iKIRs.
Plots show, for each individual, the label enrichment in the DNA of sorted T cell subpopulations during and following labeling for 49 days. CD8+ Tcm and Temra cells were sorted on the basis of their iKIR expression and the individual’s HLA ligand genotype into functional iKIR (Func KIR) (cells expressing an iKIR, in which the individual carried 1 or more allele encoding a ligand); nonfunctional iKIR (Non Func KIR) (cells expressing an iKIR whose ligand is absent from the genome); and KIR– (KIR Neg) (not expressing any of the iKIRs studied). This figure depicts label enrichment in cells expressing functional iKIRs; the remaining data are shown in Figure 4. Circles represent data, and the blue line indicates the best fit of the model to the data. Because of low or absent cell frequencies, it was not possible to collect all cell populations for all individuals.

