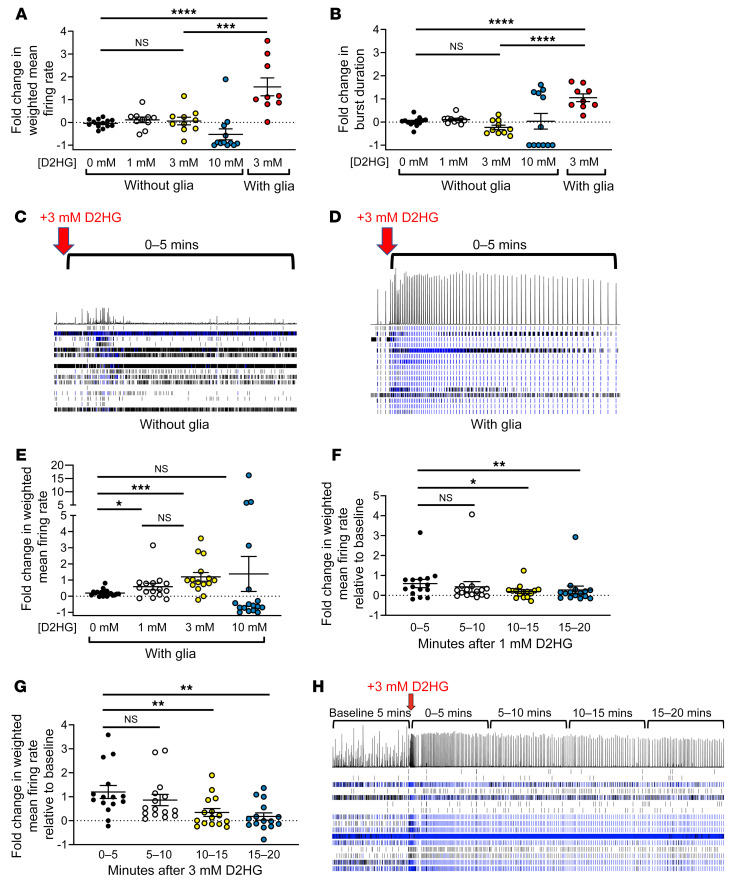
Figure 3. D2HG requires glial cells to trigger neuronal firing in vitro.
(A and B) Day 21 mouse neurons cultured with or without glia were recorded on a multi-electrode plate for 5 minutes, and then treated with vehicle or 1, 3, or 10 mM D2HG (vehicle –glia, n = 13; 1 mM D2HG +glia, n = 10; 3 mM D2HG –glia, n = 10; 10 mM D2HG –glia, n = 12; 3 mM D2HG +glia, n = 9). Experiment was repeated twice for a total of 3 times. Fold change after treatment was calculated for each well. Bars represent mean ± SEM. ***P = 0.002, ****P < 0.0001 by unpaired, 2-tailed t test (Bonferroni-adjusted P = 0.006). (C and D) Raster plots of wells with neurons only (C) or neurons with glia (D) treated with 3 mM D2HG at the time point indicated by the red arrows. Horizontal rows indicate firing activity of each electrode in a well (16 electrodes per well). Histogram above the rows depicts the summation of the firing activity of all electrodes in the well at a given time point. (E) Day 21 mouse neurons cultured with glia had baseline weighted mean firing rate recorded on a multi-electrode well plate for 5 minutes, then were treated with vehicle or 1, 3, or 10 mM D2HG (vehicle, n = 19; 1 mM D2HG, n = 15; 3 mM D2HG, n = 15; 10 mM D2HG, n = 17). Fold change of weighted mean firing rate for 5 minutes after treatment was calculated for each well. Bars represent mean ± SEM. *P < 0.05, ***P < 0.001 by 2-tailed t test. Experiment was repeated twice for a total of 3 times. (F and G) Neurons cultured with glia were recorded for 20 minutes following treatment with either 1 mM D2HG (n = 15) (F) or 3 mM D2HG (n = 15) (G), and fold change of weighted mean firing rate was calculated for each well in 5-minute intervals. Bars represent mean ± SEM. *P < 0.05, **P < 0.01 by unpaired, 2-tailed t test. Experiment was repeated twice for a total of 3 times. (H) Representative raster plot of well with neurons cultured with glia treated with 3 mM D2HG and recorded for 20 minutes following treatment.

