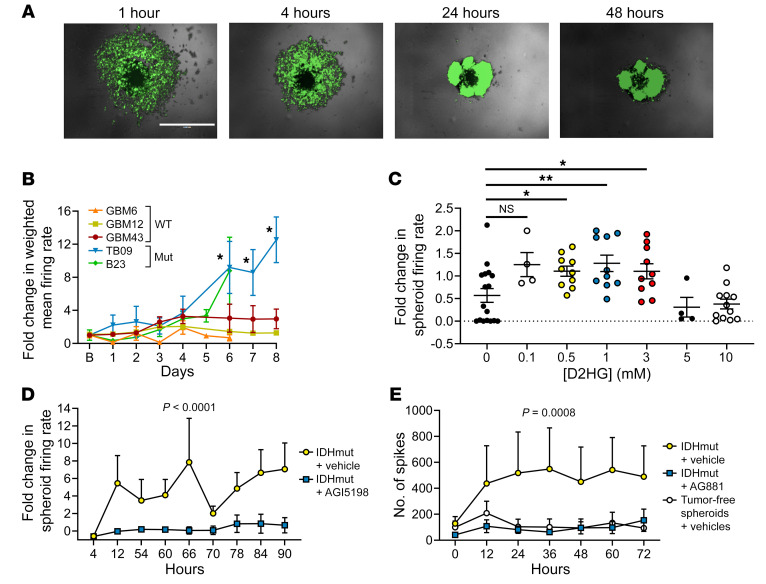
Figure 4. Modeling and treating IDHmut glioma–associated seizure-like activity with cerebral spheroids.
(A) Serial imaging demonstrates infiltration of GFP-labeled patient-derived TB09 into a spheroid over 1–48 hours. Scale bar: 1 mm. (B) Spheroids were cocultured with patient-derived glioma lines (GBM6, n = 6; GBM12, n = 32; GBM43, n = 23; TB09, n = 4; B23, n = 5), and fold change in weighted mean firing rate was calculated over time. *P < 0.05 vs. IDHwt cells via 2-tailed t test. Experiment was repeated twice for a total of 3 times. (C) Spheroids were treated with either vehicle (n = 16) or 0.1 mM D2HG (n = 4), 0.5 mM D2HG (n = 10), 1 mM D2HG (n = 10), 3 mM D2HG (n = 10), 5 mM D2HG (n = 4), or 10 mM D2HG (n = 12), and fold change of weighted mean firing rate for 10 minutes after treatment was calculated for each well. Bars represent mean ± SEM. *P < 0.05, **P < 0.01 by unpaired, 2-tailed t test. Experiment was done in triplicate. (D) Spheroids were cultured with patient-derived IDH1mut glioma TB09 and treated with either vehicle (n = 6) or 1.5 μM AGI5198 (n = 7), and fold change in weighted mean firing rate was calculated over time. Data points represent mean ± SEM. Data were analyzed with 2-way ANOVA. Experiment was done once. (E) Spheroids were either cultured alone and treated with vehicle (n = 12), or cultured with patient-derived IDH1mut glioma 905 and treated with either vehicle (n = 14) or 30 nM AG881 (n = 13). Data points represent mean ± SEM. Data were analyzed with 2-way ANOVA. Experiment was done twice.

