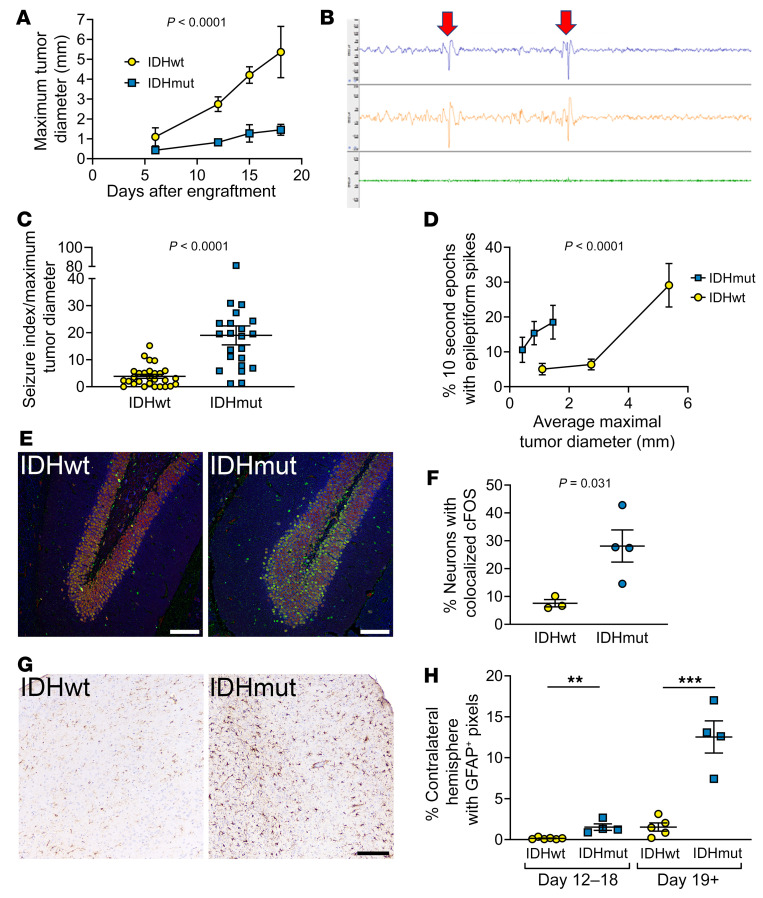
Figure 5. IDHmut glioma causes TAE in mice.
(A) Mice were engrafted with either IDHmut or IDHwt glioma. Four mice per group were euthanized on days 6, 12, 15, and 18. Intracranial tumor size at each time point was histologically measured as maximum tumor diameter. Data points represent mean ± SEM. Data were analyzed with 2-way ANOVA. (B) Top trace is EEG1, middle trace is EEG2, bottom trace is EMG. Red arrows indicate representative epileptiform spike. (C and D) Mice engrafted with IDHwt (n = 12) or IDHmut (n = 8) glioma had recordings taken at days 6, 12, and 18. EEGs were scored for percentage of 10-second epochs that contained epileptiform spikes and normalized to the tumor size in IDHwt or IDHmut glioma at day 6, 12, or 18, respectively (C), as well as directly compared (D). Bars represent mean ± SEM. Data were analyzed with unpaired, 2-tailed t test (C) or 2-way ANOVA (D). (E) Dentate gyrus of mice engrafted with either IDHwt or IDHmut glioma, stained with NeuN (1:400; ab104224, red), cFOS (1:500; ab190289, green), and MAP2 (1:1,000; ab5392, blue). (F) Percentage of NeuN colocalized with cFOS in the dentate gyrus of mice engrafted with either IDHwt (n = 3) or IDHmut (n = 4) glioma. Bars represent mean ± SEM. Data were analyzed with unpaired, 2-tailed t test. (G) Cortex contralateral to IDHwt- or IDHmut-engrafted glioma, stained with GFAP (1:500; CP040A). (H) Quantification of GFAP positivity in contralateral cortex of mice engrafted with IDHwt glioma within 12–18 days after engraftment (n = 6) or 19+ days after engraftment (n = 5) and of mice engrafted with IDHmut glioma within 12–18 days after engraftment (n = 4) or 19+ days after engraftment (n = 4) using pixel thresholding in QuPath. Scale bars in E and G: 100 μm. Bars represent mean ± SEM. **P < 0.01, ***P < 0.001 by unpaired, 2-tailed t test.

