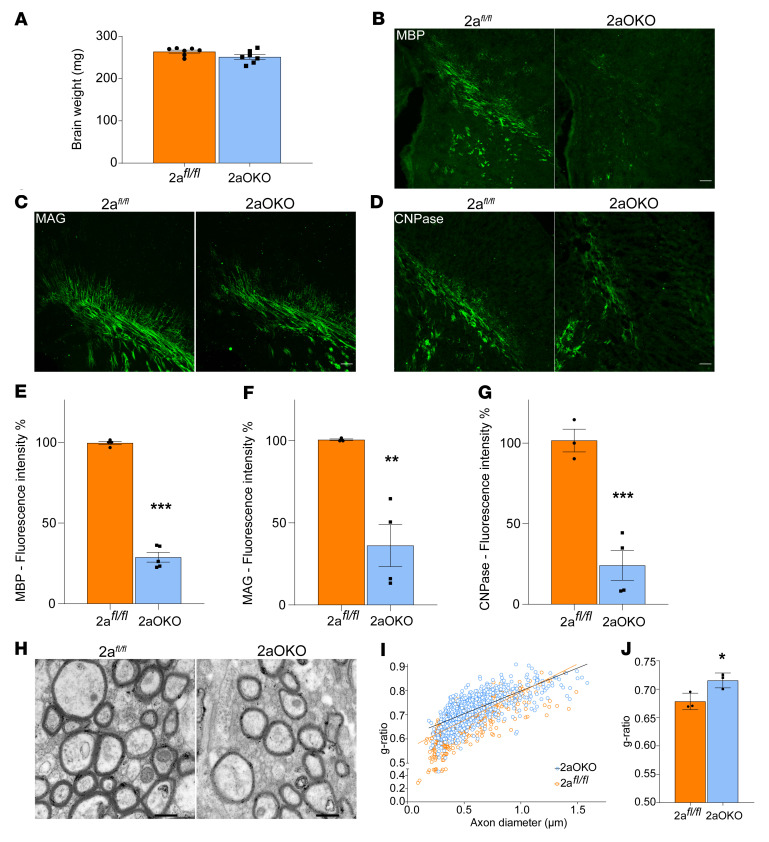
Figure 1. Loss of Mfsd2a in OPCs causes hypomyelination.
(A) P8 brain weights of 2afl/fl and 2aOKO mouse pups indicate no microcephaly due to Mfsd2a knockout in OPCs. Data are presented as mean ± SEM; n = 7 per genotype. (B–G) Representative images and quantification of coronal sections of the corpus callosum from P8 brain immunostained with the myelin marker proteins MBP (B and E), MAG (C and F), and CNPase (D and G) indicate hypomyelination in 2aOKO compared with 2afl/fl control mice. Data are presented as mean ± SEM; n = 3–5 per genotype. Scale bars: 100 μm. ***P < 0.0001, **P < 0.001 by 2-tailed Student’s t test (unpaired). (H) Representative TEM images of the corpus callosum of P67 brains from 2afl/fl and 2aOKO mice. Scale bars: 500 nm. (I) Graphical representation of the g-ratio of individual fibers in relation to axon diameter presented as scatter plots for 2afl/fl and 2aOKO mice. (J) Histogram of g-ratio comparison between 2afl/fl and 2aOKO mice. Data are presented as mean ± SEM; n = 3 per genotype. *P < 0.05 by 2-tailed Student’s t test (unpaired).

