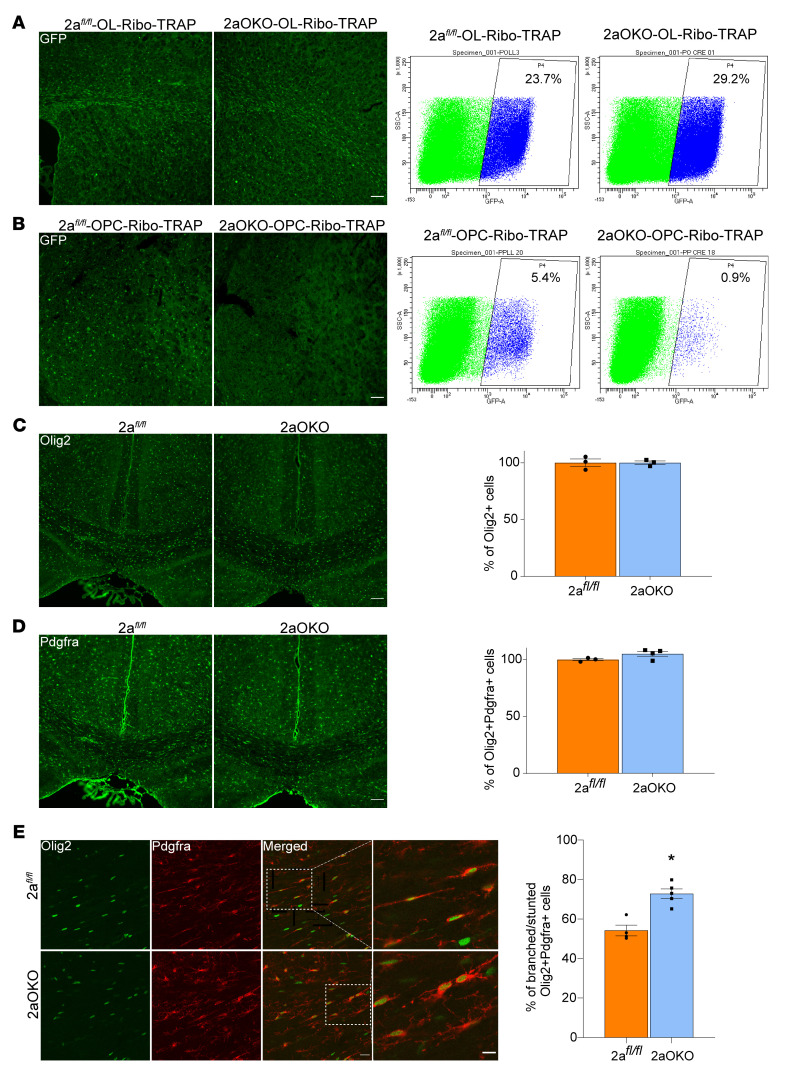
Figure 2. Mfsd2a deficiency in OPCs alters their numbers and morphology.
(A) Flow cytometry analysis of GFP+ cells from P8 brains of 2afl/fl-OL-Ribo-TRAP control and 2aOKO-OL-Ribo-TRAP mice indicates no major changes in the total oligodendrocyte lineage population resulting from Mfsd2a deficiency in OPCs. n = 3 per genotype. (B) Flow cytometry analysis of GFP+ cells from P8 2afl/fl-OPC-Ribo-TRAP control and 2aOKO-OPC-Ribo-TRAP brains revealed a decrease in GFP+ OPCs in 2aOKO-OPC-Ribo-TRAP brains. n = 3 per genotype. (C) IF analysis of P8 brain coronal sections from 2afl/fl and 2aOKO mice with Olig2 antibody indicates similar numbers of whole oligodendrocyte lineage cells at the corpus callosum in these genotypes. n = 3 per genotype. (D) Double immunostaining of P8 brain coronal sections with Pdgfra and Olig2 antibodies indicates similar Pdgfra+ OPC population numbers at the corpus callosum in 2afl/fl and 2aOKO mice. n = 3 per genotype. Scale bars: 100 μm. (E) Double immunostaining from D reveals OPC morphological heterogeneity, with an approximately 25% increase in cells with branched/stunted morphology in 2aOKO compared with 2afl/fl control mice, which mostly display a classical bipolar morphology. Scale bar: 20 μm. The far-right columns show 2.5× magnified images of the regions indicated in the merged images. Scale bar: 10 μm. Data are presented as mean ± SEM; n = 3–4 per genotype.*P < 0.01 by 2-tailed Student’s t test (unpaired).

