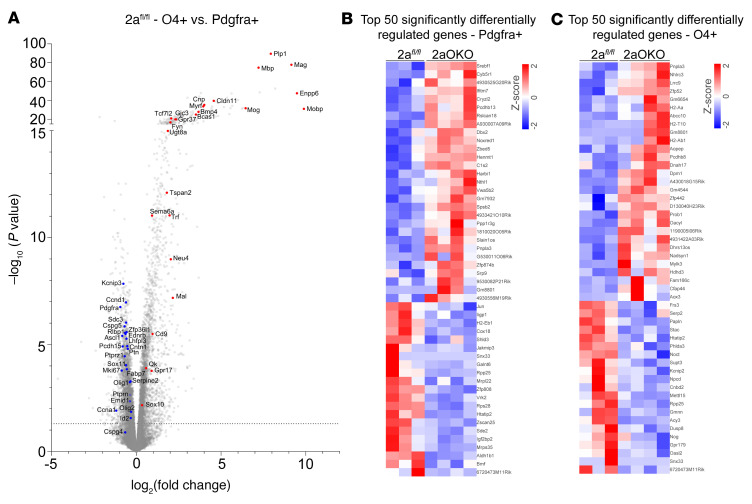
Figure 5. OPC-specific Mfsd2a deficiency alters gene expression profiles in OPC and iOL populations as determined by RNA-Seq.
(A) Volcano plot shows transcriptional profile changes associated with differentiation of OPCs to iOLs in P8 brains of 2afl/fl controls. Classical markers of MOLs and genes associated with cell differentiation are upregulated (red) and OPC markers are downregulated (blue) in O4+ cells (iOLs) compared with Pdgfra+ cells (OPCs). (B) Heatmap depicting the top 50 differentially expressed genes in OPCs from P8 brains of 2aOKO relative to 2afl/fl control mice. (C) Heatmap displaying the top 50 differentially expressed genes in iOLs from P8 brain of 2aOKO compared with 2afl/fl control mice. Color bars indicate z score transformation on median ratio–normalized counts. n = 3–4 per genotype.

