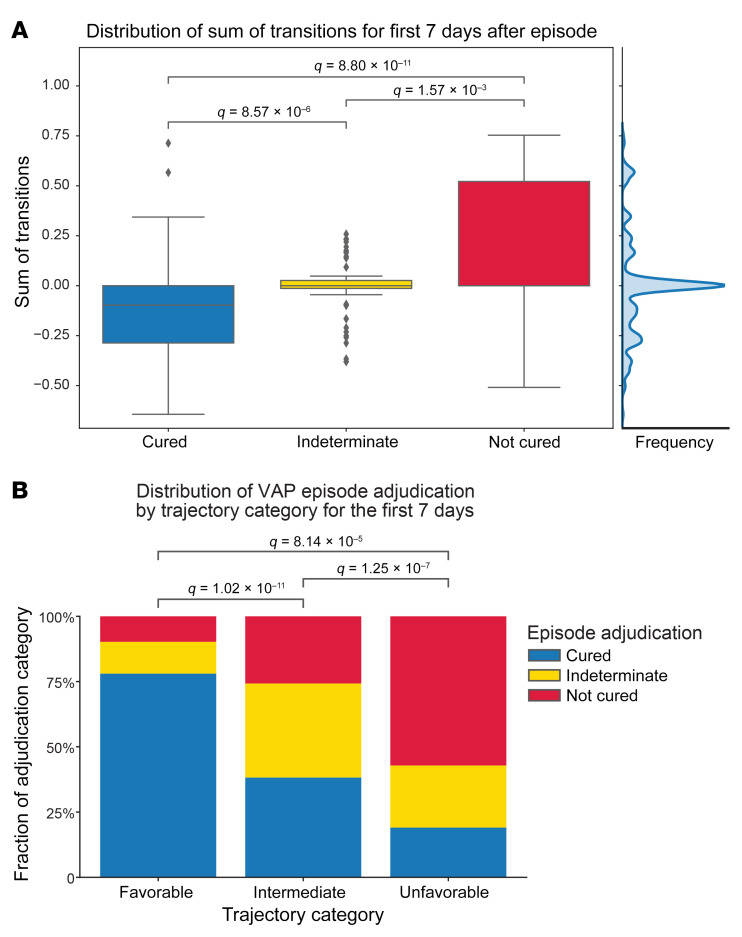
Figure 10. Unresolving VAP episodes are associated with unfavorable clinical states.
(A) Distribution of the sum of transitions for the 7 days following VAP diagnosis by episode outcome, identifying a breakpoint of 0.1 in the middle of the distribution (shown by the cumulative data histogram along the right axis). Higher sums of transitions reflect transitions to unfavorable (higher mortality) clusters. (B) Proportion of VAP episode outcomes in each trajectory category. Trajectories were grouped into favorable (sum of transitions < –0.1), indeterminate (–0.1–0.1), and unfavorable (>0.1) categories. For box-and-whisker plots, the box shows quartiles and the median, and whiskers show minimum and maximum values except for outliers, which are shown as individual data points. Numerical values were compared using the Mann-Whitney U test with FDR correction using the Benjamini-Hochberg procedure. Categorical values were compared using χ2 tests with FDR correction with the Benjamini-Hochberg procedure. A q value of less than 0.05 was the threshold for statistical significance.

