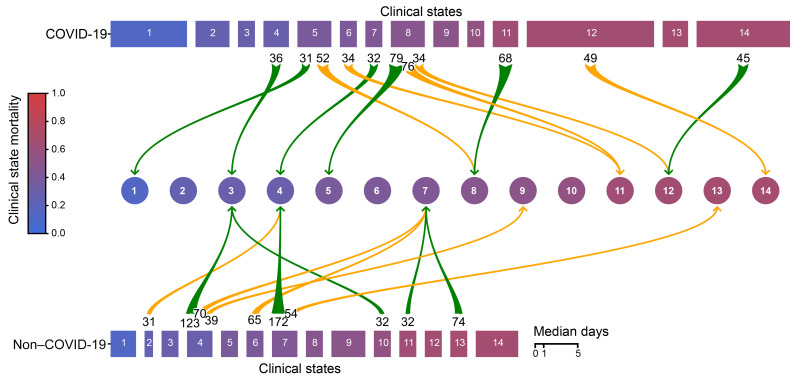
Figure 6. Patients with SARS-CoV-2 pneumonia have a longer LOS and fewer transitions between clinical states per day compared with patients with non–COVID-19–related respiratory failure.
Clinical states are ordered and numbered 1–14 according to their associated mortality (blue to red). Rectangle width reflects the median number of days spent in each clinical state. Green arrows indicate transitions to a more favorable (lower mortality) clinical state; yellow arrows mark transitions to a less favorable (higher mortality) clinical state. Numbers at the arrow bases represent the number of transitions between the 2 clinical states connected by the arrow. Only transitions that occurred more than 30 times are shown.

