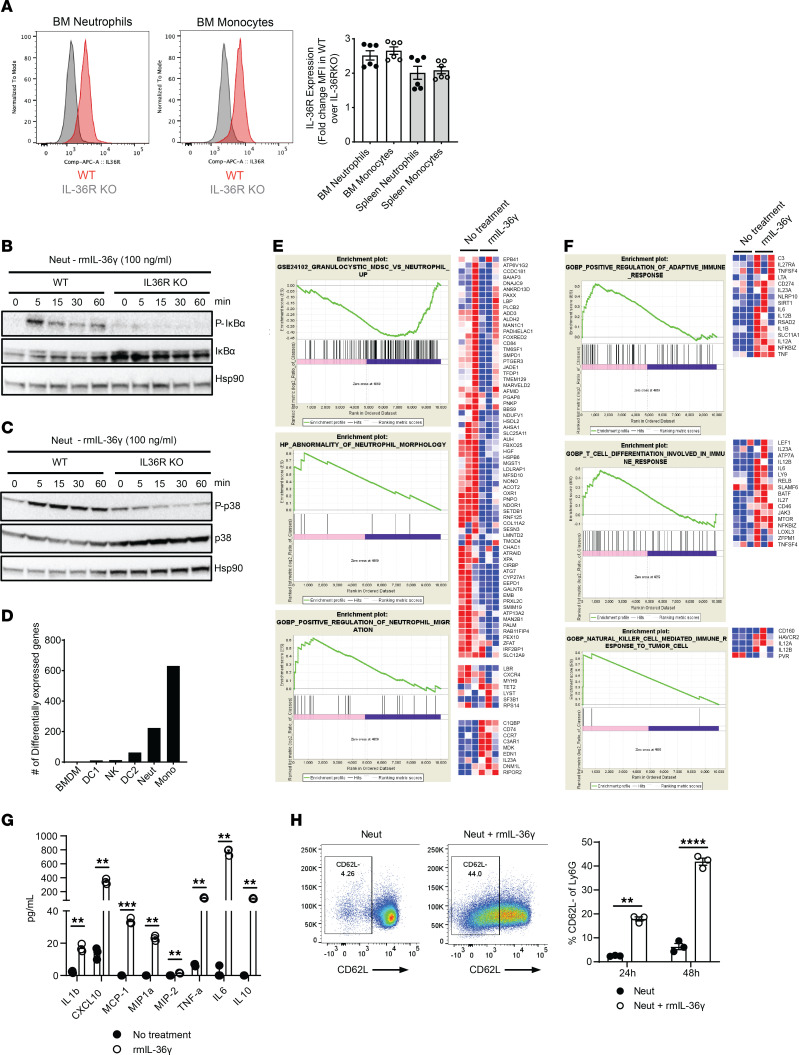
Figure 5. Cell autonomous IL-36 signaling is a potent activator of neutrophils.
(A) IL-36R expression analysis on neutrophils and monocytes from bone marrow by flow cytometry using anti-IL-36R antibody (catalog 7501, ProSci). Cells were gated on CD11b+Ly6G+ for neutrophils and CD11b+Ly6C+ for monocytes. Histograms for WT and IL-36R–KO and mean florescence intensity (MFI) calculated from triplicates and 2 independent experiments is shown in the bar graph. MFI was normalized to that in KO cells. (B and C) Western blot analysis showing IL-36–mediated signaling in neutrophils treated with 100 ng/mL rmIL-36γ in WT and IL-36R–KO mice (B) NF-κB signaling. (C) p38 MAPK signaling. Hsp90 was used as loading control. (D) Number of differentially expressed genes in various innate immune cells isolated from spleen and bone marrow of WT C57BL/6 mice upon treatment with 500 ng/mL rmIL-36γ for 6 hours. (E and F) Pathway analysis of differentially expressed genes in neutrophils isolated from bone marrow of WT C57BL/6 mice upon treatment with rmIL-36γ for 6 hours showing pathways that (E) affect neutrophil-intrinsic biology and (F) modulate various other immune cells. (G) Production of proinflammatory cytokines and chemokines by neutrophils isolated from bone marrow of WT C57BL/6 mice and treated with 500 ng/mL rmIL-36γ for 24 hours. Cytokines and chemokines were detected using a multiplexed MSD kit. (H) IL-36–mediated activation of neutrophils, as depicted by change in CD62L expression with rmIL-36γ. Representative dot plots and average percentage positive cells are shown in the bar graphs. Data are shown as mean ± SEM. (F and G) Unpaired 2-tailed Mann-Whitney t test. ****P < 0.0001. Data are representative of 1 (D–F), 2 (A, B, C, and G), 3 (H) independent experiments.

