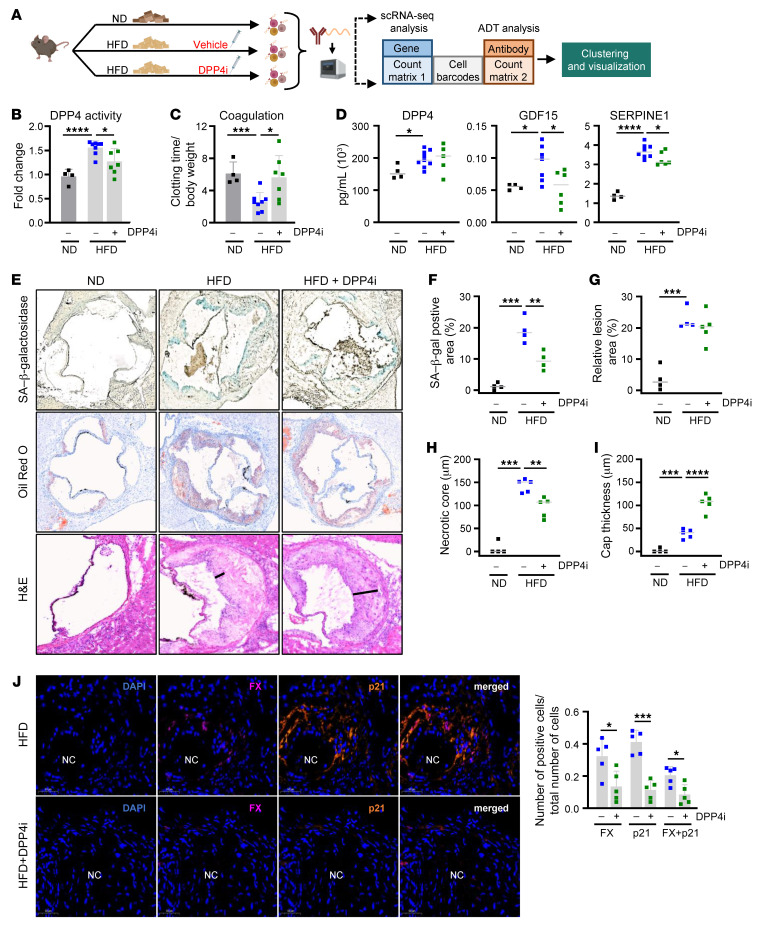
Figure 7. Inhibition of DPP4 in Ldlr–/– mouse model of atherosclerosis reduces coagulation factors and senescent cell accumulation.
(A) Diagram of the experimental design for treating Ldlr–/– mice with ND or HFD with vehicle or DPP4i. Following 16 weeks of diet and treatment, aortas were isolated, digested, and incubated with a DPP4 antibody–derived CITE-Seq tag for scRNA-Seq. (B) DPP4 activity levels were measured in serum from Ldlr–/– mice fed a ND (n = 4), HFD (n = 6), or HFD+DPP4i (n = 6). (C) Clotting time was measured in Ldlr–/– mice fed a ND, HFD, or HFD+DPP4i using tail bleeding as a surrogate. (D) Bioplex analysis of circulating DPP4, GDF15, and SERPINE1 in serum from Ldlr–/– mice fed a regular diet, HFD, or HFD+DPP4i. (E) Representative images (n = 4–5 per condition) of aortic roots from ND-, HFD-, and HFD+DPP4i–treated mice stained with SA–β-gal (top), Oil Red O (middle), and H&E (bottom). Original magnification, ×100. (F) Quantification of SA–β-gal–positive area. (G) Quantification of relative lesion area. (H) Quantification of necrotic core thickness based on H&E staining. (I) Quantification of cap thickness (black line) based on H&E staining. (J) Left: immunofluorescent analysis of aortic roots with DAPI (blue), FX (purple), and p21 (orange) signals. Necrotic core area indicated by NC. Right: percentage of FX, p21, or double-positive (FX+p21) cells in HFD or HFD+DPP4i mice (n = 5). Original magnification, ×40. In E, H&E HFD image is from a different crop of SF6E HFD. Significance was established using Student’s t test or 1-way ANOVA via Tukey’s HSD. *P ≤ 0.05; **P ≤ 0.01; ***P ≤ 0.001; ****P ≤ 0.0001.

