
Figure 3.
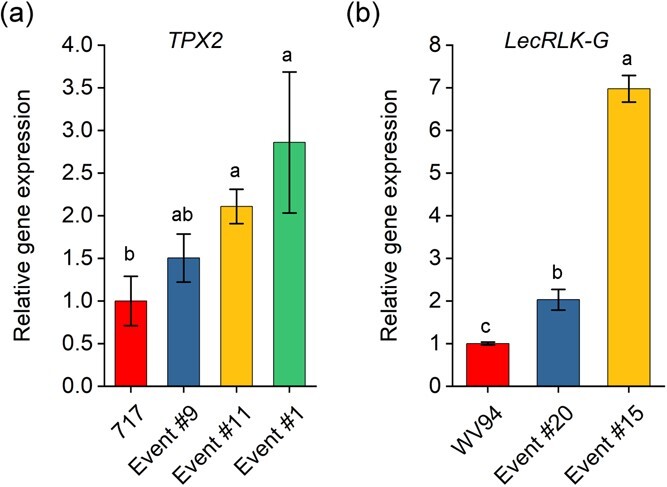
Gene activation efficiency analyses in stable transgenic Populus. (a) Expression of TPX2 in three independent transgenic events, Event #9, Event #11 and Event #1 in hybrid poplar clone “717-1B4” plants. (b) Expression of LecRLK-G in two independent transgenic events, Event #20 and Event #15 in poplar clone “WV94” plants. Bar charts represent mean ± se (n = 3 three independent plants), and different letters represent significant difference between groups (P ≤ 0.05) determined by one-way ANOVA followed by Tukey’s test.