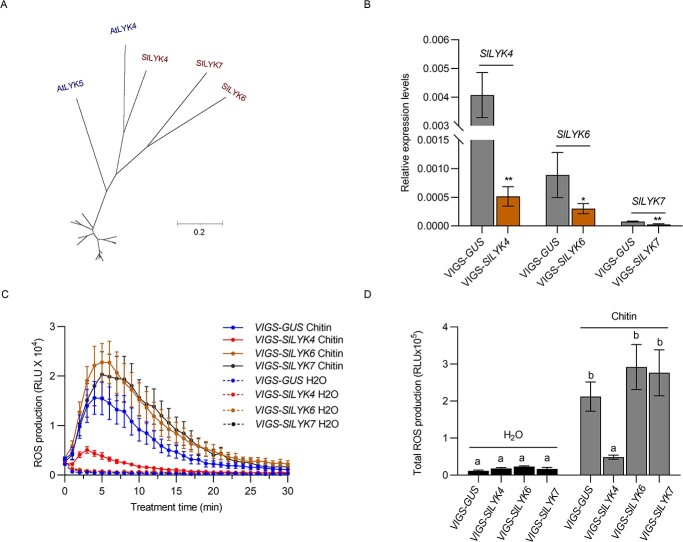
Figure 1.
SlLYK4-silencing leaves show reduced chitin responses. (A) AtLYK5 subclade. SlLYK4, SlLYK6, and SlLYK7 are clustered with AtLYK4 and AtLYK5 into one subclade. A full phylogenetic tree with all LYKs from Arabidopsis and tomato is shown in Supplementary Data Fig. S1. Except for the AtLYK5 branch, all other branches are scaled down by a factor of 10. (B) Silencing efficiency of VIGS-SlLYK4, -SlLYK6, and -SlLYK7. The silencing of SlLYK4, SlLYK6, and SlLYK7 was mediated by the VIGS approach. Silencing efficiency was compared between VIGS-GUS and its respective VIGS construct. The relative transcript levels were determined by qRT–PCR. SlEF1α was used as an internal control. Data are shown as mean ± standard deviation (n = 3–5). Asterisks indicate significant differences between the control and VIGS target (*P ≤ .05, **P ≤ .01, t-test). (C, D) Production of ROS. ROS were measured using a chemiluminescence assay. ROS signals were recorded for 30 minutes after treatment with 50 μg/ml chitin (C), and total ROS production within 30 minutes is shown in (D). Data are expressed as mean ± standard error (n = 6–8). Different letters indicate significant differences between the control and VIGS target (P ≤ .05, one-way ANOVA).

