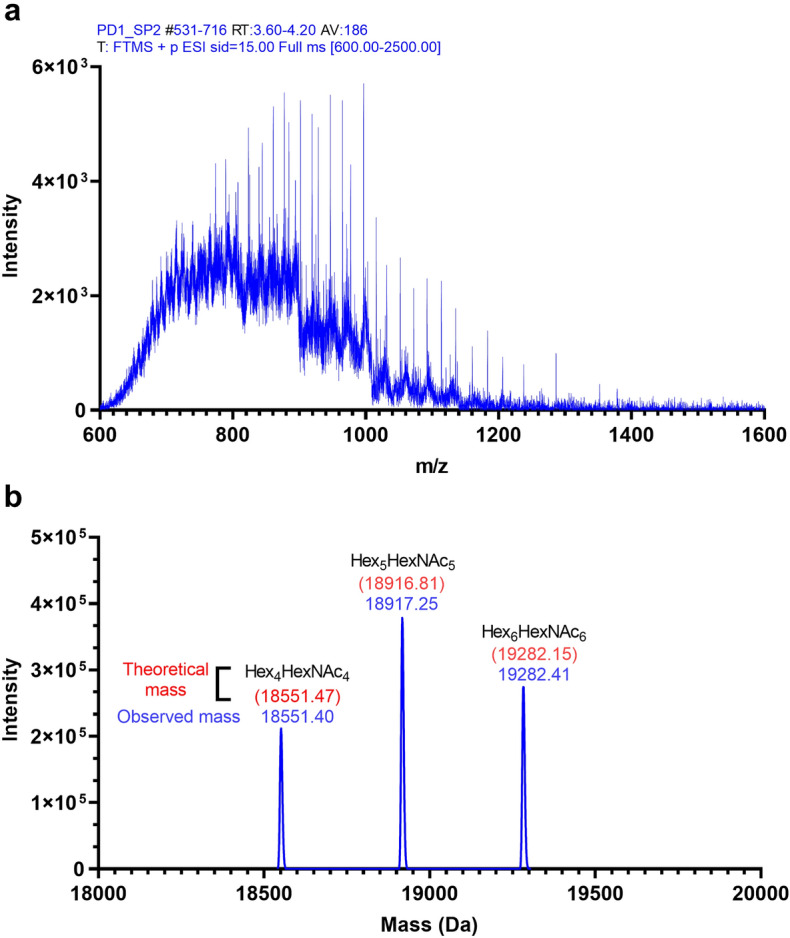
Figure 3.

Intact mass analysis of N-linked removed recombinant PD-1 treated with sialidases. (a) An average raw mass spectrum of the intact protein over eluted retention time that was used for deconvolution. (b) A representative deconvolution mass of the sample; theoretical mass with the proposed glycan component was calculated for each deconvoluted glycoform (red), compared with observed mass (blue). Graphs were generated using GraphPad Prism version 9.4.1 for Windows (https://www.graphpad.com/) using original data obtained from Biopharma Finder 3.0 and Qual Browser, Thermo Xcalibur 3.1.66.10, as shown in supplementary Figs. S4, 5.
